COPPERAS COVE, TX ZIP Code
| City | COPPERAS COVE |
| State | Texas |
| ZIP Codes count | 1 (see all) |
| Post offices count | 1 (see all) |
| Total population | 32,731 (see all) |
ZIP Code in COPPERAS COVE, Texas
76522
This list contains only 5-digit ZIP codes. Use our zip code lookup by address feature to get the full 9-digit (ZIP+4) code.
List of COPPERAS COVE, TX ZIP Codes
| ZIP | TYPE | POPU |
|---|---|---|
| 76522 | STANDARD | 40,050 |
Post offices
COPPERAS COVE — Post Office™ 802 E AVENUE D COPPERAS COVE, TX 76522-9998 |
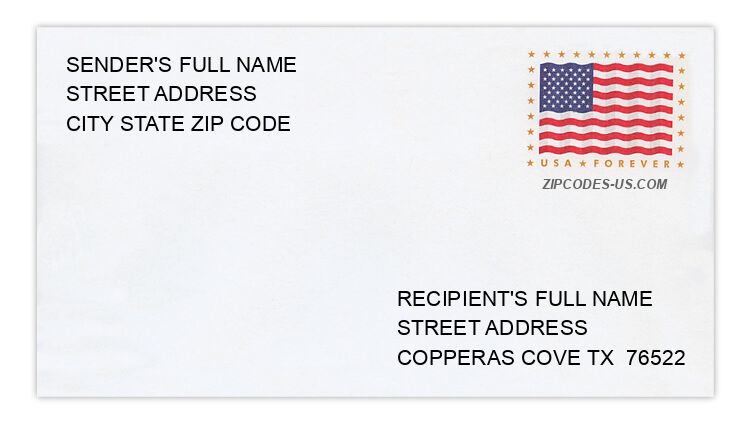
Envelope example
On the bottom center of the envelope, write the address you want your letter delivered to. Include the following on separate lines:
- Recipient's full name
- Full street address
- City, State, and ZIP Code
Using the same format, write the return address in the top left corner.
Using the full ZIP+4 Code when mailing via the USPS ensures the fastest, most accurate mailing possible. If you are not sure of the full 9-digit ZIP Code, use the 5-digit ZIP Code to avoid loss of letter or package.
The recipient address information is provided for your reference.
Address example
575 COUNTY ROAD 4876
COPPERAS COVE TX 76522-6233
COPPERAS COVE TX 76522-6233
478 COUNTY ROAD 4878
COPPERAS COVE TX 76522-6143
COPPERAS COVE TX 76522-6143
19 KAREN SUE CIR
COPPERAS COVE TX 76522-1116
COPPERAS COVE TX 76522-1116
713 N 1ST ST
COPPERAS COVE TX 76522-1313
COPPERAS COVE TX 76522-1313
4176 SHASTA
COPPERAS COVE TX 76522-7829
COPPERAS COVE TX 76522-7829
1099 TABLE ROCK RD
COPPERAS COVE TX 76522-7109
COPPERAS COVE TX 76522-7109
Map
Hover over the map to see the ZIP code
Census data for COPPERAS COVE, TX
Demographic and housing estimates in COPPERAS COVE, TX
| Total population | 32,731 |
| Male | 15,541 |
| Female | 17,190 |
| Total population | 32,731 |
| Under 5 years | 2,496 |
| 5 to 9 years | 2,345 |
| 10 to 14 years | 2,545 |
| 15 to 19 years | 2,012 |
| 20 to 24 years | 2,509 |
| 25 to 34 years | 6,431 |
| 35 to 44 years | 4,574 |
| 45 to 54 years | 3,782 |
| 55 to 59 years | 1,551 |
| 60 to 64 years | 1,199 |
| 65 to 74 years | 1,959 |
| 75 to 84 years | 955 |
| 85 years and over | 373 |
| Median age (years) | 31.9 |
| Under 18 years | 8,750 |
| 16 years and over | 24,890 |
| 18 years and over | 23,981 |
| 21 years and over | 23,017 |
| 62 years and over | 3,911 |
| 65 years and over | 3,287 |
| Total population | 32,731 |
| One race | 29,609 |
| White | 22,249 |
| Black or African American | 5,163 |
| American Indian and Alaska Native | 188 |
| Asian | 858 |
| Native Hawaiian and Other Pacific Islander | 541 |
| Some other race | 610 |
| Two or more races | 3,122 |
| Citizen, VOTING AGE 18 and over population | 23,019 |
| Male Citizen, VOTING AGE 18 and over population | 10,790 |
| Female Citizen, VOTING AGE 18 and over population | 12,229 |
Social characteristics in COPPERAS COVE, TX
| Total households | 12,300 |
| Family households (families) | 8,613 |
| Married-couple family | 6,219 |
| Male householder, no wife present, family | 572 |
| Female householder, no husband present, family | 1,822 |
| Nonfamily households | 3,687 |
| Average household size | 2.64 |
| Average family size | 3.15 |
Economic characteristics in COPPERAS COVE, TX
| Total households | 12,300 |
| Less than $10,000 | 611 |
| $10,000 to $14,999 | 604 |
| $15,000 to $24,999 | 1,117 |
| $25,000 to $34,999 | 1,404 |
| $35,000 to $49,999 | 2,070 |
| $50,000 to $74,999 | 2,766 |
| $75,000 to $99,999 | 1,661 |
| $100,000 to $149,999 | 1,550 |
| $150,000 to $199,999 | 266 |
| $200,000 or more | 251 |
| Median household income (dollars) | 52,715 |
Housing characteristics in COPPERAS COVE, TX
| Total housing units | 13,963 |
| Occupied housing units | 12,300 |
| Vacant housing units | 1,663 |
| Total housing units | 13,963 |
| 1-unit, detached | 10,008 |
| 1-unit, attached | 267 |
| 2 units | 996 |
| 3 or 4 units | 708 |
| 5 to 9 units | 650 |
| 10 to 19 units | 526 |
| 20 or more units | 509 |
| Mobile home | 277 |
| Boat, RV, van, etc. | 22 |
| Total housing units | 13,963 |
| Built 2014 or later | 289 |
| Built 2010 to 2013 | 824 |
| Built 2000 to 2009 | 2,266 |
| Built 1990 to 1999 | 2,585 |
| Built 1980 to 1989 | 2,387 |
| Built 1970 to 1979 | 3,018 |
| Built 1960 to 1969 | 1,553 |
| Built 1950 to 1959 | 647 |
| Built 1940 to 1949 | 253 |
| Built 1939 or earlier | 141 |
| Total housing units | 13,963 |
| 1 room | 129 |
| 2 rooms | 357 |
| 3 rooms | 808 |
| 4 rooms | 2,088 |
| 5 rooms | 3,540 |
| 6 rooms | 3,776 |
| 7 rooms | 1,733 |
| 8 rooms | 890 |
| 9 rooms or more | 642 |
| Median rooms | 5.5 |
| Total housing units | 13,963 |
| No bedroom | 135 |
| 1 bedroom | 1,043 |
| 2 bedrooms | 2,396 |
| 3 bedrooms | 6,882 |
| 4 bedrooms | 3,325 |
| 5 or more bedrooms | 182 |
| Occupied housing units | 12,300 |
| Owner-occupied | 6,746 |
| Renter-occupied | 5,554 |
| Average household size of owner-occupied unit | 2.72 |
| Average household size of renter-occupied unit | 2.54 |
| Occupied housing units | 12,300 |
| Moved in 2017 or later | 1,199 |
| Moved in 2015 to 2016 | 2,267 |
| Moved in 2010 to 2014 | 3,974 |
| Moved in 2000 to 2009 | 2,420 |
| Moved in 1990 to 1999 | 1,274 |
| Moved in 1989 and earlier | 1,166 |
| Owner-occupied units | 6,746 |
| Less than $50,000 | 312 |
| $50,000 to $99,999 | 2,561 |
| $100,000 to $149,999 | 2,232 |
| $150,000 to $199,999 | 1,009 |
| $200,000 to $299,999 | 506 |
| $300,000 to $499,999 | 90 |
| $500,000 to $999,999 | 7 |
| $1,000,000 or more | 29 |
| Median (dollars) | 110,000 |
| Owner-occupied units | 6,746 |
| Housing units with a mortgage | 4,416 |
| Housing units without a mortgage | 2,330 |
| Occupied units paying rent | 5,406 |
| Less than $500 | 478 |
| $500 to $999 | 3,025 |
| $1,000 to $1,499 | 1,450 |
| $1,500 to $1,999 | 445 |
| $2,000 to $2,499 | 8 |
| $2,500 to $2,999 | 0 |
| $3,000 or more | 0 |
| Median (dollars) | 887 |
| No rent paid | 148 |
Data is based on 2018 Census
ZIP Codes for other locations
State for COPPERAS COVE
Texas ZIP CodesOther cities in Texas