DANBURY, TX ZIP Code
| City | DANBURY |
| State | Texas |
| ZIP Codes count | 1 (see all) |
| Post offices count | 1 (see all) |
| Total population | 1,391 (see all) |
ZIP Code in DANBURY, Texas
77534
This list contains only 5-digit ZIP codes. Use our zip code lookup by address feature to get the full 9-digit (ZIP+4) code.
List of DANBURY, TX ZIP Codes
| ZIP | TYPE | POPU |
|---|---|---|
| 77534 | STANDARD | 3,125 |
Post offices
DANBURY — Post Office™ 6003 5TH ST DANBURY, TX 77534-9998 |
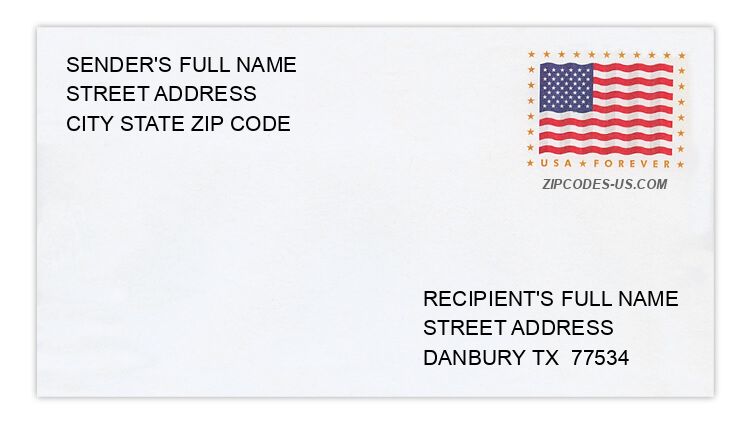
Envelope example
On the bottom center of the envelope, write the address you want your letter delivered to. Include the following on separate lines:
- Recipient's full name
- Full street address
- City, State, and ZIP Code
Using the same format, write the return address in the top left corner.
Using the full ZIP+4 Code when mailing via the USPS ensures the fastest, most accurate mailing possible. If you are not sure of the full 9-digit ZIP Code, use the 5-digit ZIP Code to avoid loss of letter or package.
The recipient address information is provided for your reference.
Address example
6114 10TH ST
DANBURY TX 77534-8862
DANBURY TX 77534-8862
5443 7TH ST
DANBURY TX 77534-8003
DANBURY TX 77534-8003
5129 8TH ST
DANBURY TX 77534-8872
DANBURY TX 77534-8872
7357 FM 2004 RD
DANBURY TX 77534-8701
DANBURY TX 77534-8701
2293 MAIN ST
DANBURY TX 77534-8779
DANBURY TX 77534-8779
16454 MEADOW LN
DANBURY TX 77534-9772
DANBURY TX 77534-9772
Map
Hover over the map to see the ZIP code
Census data for DANBURY, TX
Demographic and housing estimates in DANBURY, TX
| Total population | 1,391 |
| Male | 721 |
| Female | 670 |
| Total population | 1,391 |
| Under 5 years | 27 |
| 5 to 9 years | 90 |
| 10 to 14 years | 118 |
| 15 to 19 years | 122 |
| 20 to 24 years | 150 |
| 25 to 34 years | 85 |
| 35 to 44 years | 173 |
| 45 to 54 years | 223 |
| 55 to 59 years | 107 |
| 60 to 64 years | 108 |
| 65 to 74 years | 89 |
| 75 to 84 years | 82 |
| 85 years and over | 17 |
| Median age (years) | 40.4 |
| Under 18 years | 311 |
| 16 years and over | 1,125 |
| 18 years and over | 1,080 |
| 21 years and over | 972 |
| 62 years and over | 251 |
| 65 years and over | 188 |
| Total population | 1,391 |
| One race | 1,378 |
| White | 1,305 |
| Black or African American | 35 |
| American Indian and Alaska Native | 0 |
| Asian | 13 |
| Native Hawaiian and Other Pacific Islander | 0 |
| Some other race | 25 |
| Two or more races | 13 |
| Citizen, VOTING AGE 18 and over population | 1,003 |
| Male Citizen, VOTING AGE 18 and over population | 498 |
| Female Citizen, VOTING AGE 18 and over population | 505 |
Social characteristics in DANBURY, TX
| Total households | 519 |
| Family households (families) | 377 |
| Married-couple family | 267 |
| Male householder, no wife present, family | 31 |
| Female householder, no husband present, family | 79 |
| Nonfamily households | 142 |
| Average household size | 2.68 |
| Average family size | 3.19 |
Economic characteristics in DANBURY, TX
| Total households | 519 |
| Less than $10,000 | 37 |
| $10,000 to $14,999 | 27 |
| $15,000 to $24,999 | 24 |
| $25,000 to $34,999 | 25 |
| $35,000 to $49,999 | 63 |
| $50,000 to $74,999 | 123 |
| $75,000 to $99,999 | 69 |
| $100,000 to $149,999 | 84 |
| $150,000 to $199,999 | 46 |
| $200,000 or more | 21 |
| Median household income (dollars) | 66,734 |
Housing characteristics in DANBURY, TX
| Total housing units | 639 |
| Occupied housing units | 519 |
| Vacant housing units | 120 |
| Total housing units | 639 |
| 1-unit, detached | 524 |
| 1-unit, attached | 12 |
| 2 units | 13 |
| 3 or 4 units | 3 |
| 5 to 9 units | 51 |
| 10 to 19 units | 11 |
| 20 or more units | 12 |
| Mobile home | 13 |
| Boat, RV, van, etc. | 0 |
| Total housing units | 639 |
| Built 2014 or later | 8 |
| Built 2010 to 2013 | 0 |
| Built 2000 to 2009 | 51 |
| Built 1990 to 1999 | 64 |
| Built 1980 to 1989 | 122 |
| Built 1970 to 1979 | 140 |
| Built 1960 to 1969 | 148 |
| Built 1950 to 1959 | 65 |
| Built 1940 to 1949 | 4 |
| Built 1939 or earlier | 37 |
| Total housing units | 639 |
| 1 room | 16 |
| 2 rooms | 0 |
| 3 rooms | 34 |
| 4 rooms | 110 |
| 5 rooms | 219 |
| 6 rooms | 152 |
| 7 rooms | 76 |
| 8 rooms | 27 |
| 9 rooms or more | 5 |
| Median rooms | 5.2 |
| Total housing units | 639 |
| No bedroom | 20 |
| 1 bedroom | 32 |
| 2 bedrooms | 120 |
| 3 bedrooms | 413 |
| 4 bedrooms | 54 |
| 5 or more bedrooms | 0 |
| Occupied housing units | 519 |
| Owner-occupied | 403 |
| Renter-occupied | 116 |
| Average household size of owner-occupied unit | 2.65 |
| Average household size of renter-occupied unit | 2.78 |
| Occupied housing units | 519 |
| Moved in 2017 or later | 0 |
| Moved in 2015 to 2016 | 40 |
| Moved in 2010 to 2014 | 87 |
| Moved in 2000 to 2009 | 150 |
| Moved in 1990 to 1999 | 103 |
| Moved in 1989 and earlier | 139 |
| Owner-occupied units | 403 |
| Less than $50,000 | 13 |
| $50,000 to $99,999 | 102 |
| $100,000 to $149,999 | 149 |
| $150,000 to $199,999 | 72 |
| $200,000 to $299,999 | 54 |
| $300,000 to $499,999 | 9 |
| $500,000 to $999,999 | 4 |
| $1,000,000 or more | 0 |
| Median (dollars) | 127,700 |
| Owner-occupied units | 403 |
| Housing units with a mortgage | 175 |
| Housing units without a mortgage | 228 |
| Occupied units paying rent | 116 |
| Less than $500 | 4 |
| $500 to $999 | 72 |
| $1,000 to $1,499 | 32 |
| $1,500 to $1,999 | 4 |
| $2,000 to $2,499 | 0 |
| $2,500 to $2,999 | 0 |
| $3,000 or more | 4 |
| Median (dollars) | 863 |
| No rent paid | 0 |
Data is based on 2018 Census
ZIP Codes for other locations
State for DANBURY
Texas ZIP CodesOther cities in Texas