DE LEON, TX ZIP Code
| City | DE LEON |
| State | Texas |
| ZIP Codes count | 1 (see all) |
| Post offices count | 1 (see all) |
| Total population | 2,470 (see all) |
ZIP Code in DE LEON, Texas
76444
This list contains only 5-digit ZIP codes. Use our zip code lookup by address feature to get the full 9-digit (ZIP+4) code.
List of DE LEON, TX ZIP Codes
| ZIP | TYPE | POPU |
|---|---|---|
| 76444 | STANDARD | 3,477 |
Post offices
DE LEON — Post Office™ 540 W NAVARRO AVE DE LEON, TX 76444-9998 |
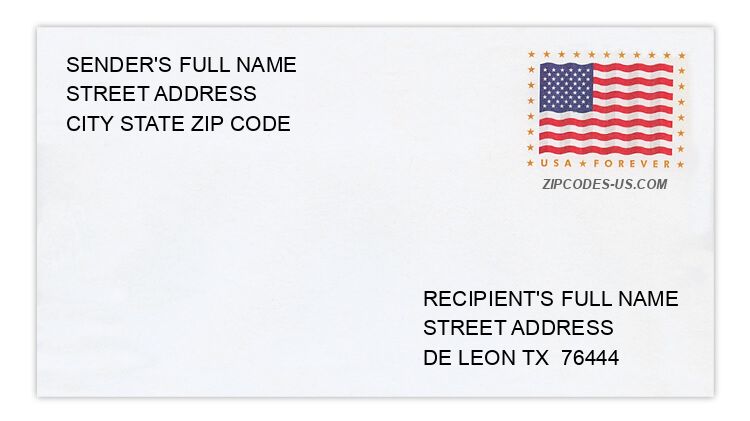
Envelope example
On the bottom center of the envelope, write the address you want your letter delivered to. Include the following on separate lines:
- Recipient's full name
- Full street address
- City, State, and ZIP Code
Using the same format, write the return address in the top left corner.
Using the full ZIP+4 Code when mailing via the USPS ensures the fastest, most accurate mailing possible. If you are not sure of the full 9-digit ZIP Code, use the 5-digit ZIP Code to avoid loss of letter or package.
The recipient address information is provided for your reference.
Address example
268 COUNTY ROAD 466A
DE LEON TX 76444-6975
DE LEON TX 76444-6975
498 COUNTY ROAD 490
DE LEON TX 76444-6421
DE LEON TX 76444-6421
126 COUNTY ROAD 526
DE LEON TX 76444-6407
DE LEON TX 76444-6407
433 E ALMANTE AVE
DE LEON TX 76444-1219
DE LEON TX 76444-1219
6928 HIGHWAY 2247
DE LEON TX 76444-6120
DE LEON TX 76444-6120
1079 W NORTH PARK AVE
DE LEON TX 76444-11ND
DE LEON TX 76444-11ND
Map
Hover over the map to see the ZIP code
Census data for DE LEON, TX
Demographic and housing estimates in DE LEON, TX
| Total population | 2,470 |
| Male | 1,112 |
| Female | 1,358 |
| Total population | 2,470 |
| Under 5 years | 154 |
| 5 to 9 years | 162 |
| 10 to 14 years | 152 |
| 15 to 19 years | 169 |
| 20 to 24 years | 122 |
| 25 to 34 years | 367 |
| 35 to 44 years | 253 |
| 45 to 54 years | 442 |
| 55 to 59 years | 98 |
| 60 to 64 years | 150 |
| 65 to 74 years | 227 |
| 75 to 84 years | 85 |
| 85 years and over | 89 |
| Median age (years) | 40.1 |
| Under 18 years | 551 |
| 16 years and over | 1,945 |
| 18 years and over | 1,919 |
| 21 years and over | 1,826 |
| 62 years and over | 510 |
| 65 years and over | 401 |
| Total population | 2,470 |
| One race | 2,382 |
| White | 2,264 |
| Black or African American | 41 |
| American Indian and Alaska Native | 32 |
| Asian | 0 |
| Native Hawaiian and Other Pacific Islander | 0 |
| Some other race | 45 |
| Two or more races | 88 |
| Citizen, VOTING AGE 18 and over population | 1,829 |
| Male Citizen, VOTING AGE 18 and over population | 758 |
| Female Citizen, VOTING AGE 18 and over population | 1,071 |
Social characteristics in DE LEON, TX
| Total households | 995 |
| Family households (families) | 650 |
| Married-couple family | 398 |
| Male householder, no wife present, family | 54 |
| Female householder, no husband present, family | 198 |
| Nonfamily households | 345 |
| Average household size | 2.44 |
| Average family size | 3.04 |
Economic characteristics in DE LEON, TX
| Total households | 995 |
| Less than $10,000 | 162 |
| $10,000 to $14,999 | 57 |
| $15,000 to $24,999 | 154 |
| $25,000 to $34,999 | 73 |
| $35,000 to $49,999 | 148 |
| $50,000 to $74,999 | 178 |
| $75,000 to $99,999 | 35 |
| $100,000 to $149,999 | 147 |
| $150,000 to $199,999 | 31 |
| $200,000 or more | 10 |
| Median household income (dollars) | 40,655 |
Housing characteristics in DE LEON, TX
| Total housing units | 1,141 |
| Occupied housing units | 995 |
| Vacant housing units | 146 |
| Total housing units | 1,141 |
| 1-unit, detached | 792 |
| 1-unit, attached | 0 |
| 2 units | 46 |
| 3 or 4 units | 32 |
| 5 to 9 units | 0 |
| 10 to 19 units | 0 |
| 20 or more units | 26 |
| Mobile home | 245 |
| Boat, RV, van, etc. | 0 |
| Total housing units | 1,141 |
| Built 2014 or later | 5 |
| Built 2010 to 2013 | 0 |
| Built 2000 to 2009 | 47 |
| Built 1990 to 1999 | 80 |
| Built 1980 to 1989 | 186 |
| Built 1970 to 1979 | 228 |
| Built 1960 to 1969 | 213 |
| Built 1950 to 1959 | 117 |
| Built 1940 to 1949 | 99 |
| Built 1939 or earlier | 166 |
| Total housing units | 1,141 |
| 1 room | 5 |
| 2 rooms | 5 |
| 3 rooms | 139 |
| 4 rooms | 168 |
| 5 rooms | 306 |
| 6 rooms | 219 |
| 7 rooms | 186 |
| 8 rooms | 42 |
| 9 rooms or more | 71 |
| Median rooms | 5.3 |
| Total housing units | 1,141 |
| No bedroom | 5 |
| 1 bedroom | 122 |
| 2 bedrooms | 311 |
| 3 bedrooms | 579 |
| 4 bedrooms | 117 |
| 5 or more bedrooms | 7 |
| Occupied housing units | 995 |
| Owner-occupied | 709 |
| Renter-occupied | 286 |
| Average household size of owner-occupied unit | 2.70 |
| Average household size of renter-occupied unit | 1.81 |
| Occupied housing units | 995 |
| Moved in 2017 or later | 43 |
| Moved in 2015 to 2016 | 86 |
| Moved in 2010 to 2014 | 229 |
| Moved in 2000 to 2009 | 327 |
| Moved in 1990 to 1999 | 157 |
| Moved in 1989 and earlier | 153 |
| Owner-occupied units | 709 |
| Less than $50,000 | 275 |
| $50,000 to $99,999 | 250 |
| $100,000 to $149,999 | 159 |
| $150,000 to $199,999 | 15 |
| $200,000 to $299,999 | 0 |
| $300,000 to $499,999 | 10 |
| $500,000 to $999,999 | 0 |
| $1,000,000 or more | 0 |
| Median (dollars) | 76,400 |
| Owner-occupied units | 709 |
| Housing units with a mortgage | 268 |
| Housing units without a mortgage | 441 |
| Occupied units paying rent | 260 |
| Less than $500 | 131 |
| $500 to $999 | 105 |
| $1,000 to $1,499 | 24 |
| $1,500 to $1,999 | 0 |
| $2,000 to $2,499 | 0 |
| $2,500 to $2,999 | 0 |
| $3,000 or more | 0 |
| Median (dollars) | 494 |
| No rent paid | 26 |
Data is based on 2018 Census
ZIP Codes for other locations
State for DE LEON
Texas ZIP CodesOther cities in Texas