EL CAMPO, TX ZIP Code
| City | EL CAMPO |
| State | Texas |
| ZIP Codes count | 1 (see all) |
| Post offices count | 1 (see all) |
| Total population | 11,670 (see all) |
ZIP Code in EL CAMPO, Texas
77437
This list contains only 5-digit ZIP codes. Use our zip code lookup by address feature to get the full 9-digit (ZIP+4) code.
List of EL CAMPO, TX ZIP Codes
| ZIP | TYPE | POPU |
|---|---|---|
| 77437 | STANDARD | 18,529 |
Post offices
EL CAMPO — Post Office™ 110 S MECHANIC ST EL CAMPO, TX 77437-9998 |
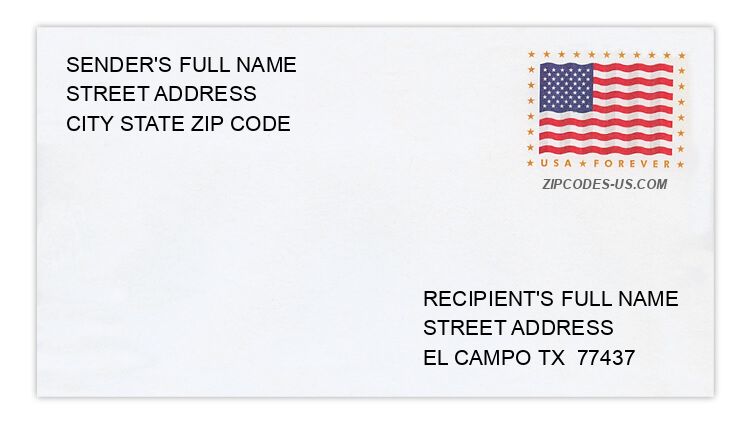
Envelope example
On the bottom center of the envelope, write the address you want your letter delivered to. Include the following on separate lines:
- Recipient's full name
- Full street address
- City, State, and ZIP Code
Using the same format, write the return address in the top left corner.
Using the full ZIP+4 Code when mailing via the USPS ensures the fastest, most accurate mailing possible. If you are not sure of the full 9-digit ZIP Code, use the 5-digit ZIP Code to avoid loss of letter or package.
The recipient address information is provided for your reference.
Address example
1166 CHINA ST
EL CAMPO TX 77437-3224
EL CAMPO TX 77437-3224
814 N PAYNE ST
EL CAMPO TX 77437-3865
EL CAMPO TX 77437-3865
2720 W CREEK DR
EL CAMPO TX 77437-2836
EL CAMPO TX 77437-2836
254 WESTMOOR RD
EL CAMPO TX 77437-8941
EL CAMPO TX 77437-8941
2969 WILLOW CREEK DR
EL CAMPO TX 77437-2171
EL CAMPO TX 77437-2171
619 WRIGHT ST
EL CAMPO TX 77437-5533
EL CAMPO TX 77437-5533
Map
Hover over the map to see the ZIP code
Census data for EL CAMPO, TX
Demographic and housing estimates in EL CAMPO, TX
| Total population | 11,670 |
| Male | 5,333 |
| Female | 6,337 |
| Total population | 11,670 |
| Under 5 years | 1,002 |
| 5 to 9 years | 1,055 |
| 10 to 14 years | 1,074 |
| 15 to 19 years | 747 |
| 20 to 24 years | 682 |
| 25 to 34 years | 1,295 |
| 35 to 44 years | 1,227 |
| 45 to 54 years | 1,276 |
| 55 to 59 years | 1,024 |
| 60 to 64 years | 611 |
| 65 to 74 years | 817 |
| 75 to 84 years | 621 |
| 85 years and over | 239 |
| Median age (years) | 34.9 |
| Under 18 years | 3,615 |
| 16 years and over | 8,436 |
| 18 years and over | 8,055 |
| 21 years and over | 7,654 |
| 62 years and over | 1,963 |
| 65 years and over | 1,677 |
| Total population | 11,670 |
| One race | 11,567 |
| White | 9,722 |
| Black or African American | 1,211 |
| American Indian and Alaska Native | 22 |
| Asian | 0 |
| Native Hawaiian and Other Pacific Islander | 0 |
| Some other race | 612 |
| Two or more races | 103 |
| Citizen, VOTING AGE 18 and over population | 6,983 |
| Male Citizen, VOTING AGE 18 and over population | 3,204 |
| Female Citizen, VOTING AGE 18 and over population | 3,779 |
Social characteristics in EL CAMPO, TX
| Total households | 4,104 |
| Family households (families) | 2,969 |
| Married-couple family | 1,944 |
| Male householder, no wife present, family | 292 |
| Female householder, no husband present, family | 733 |
| Nonfamily households | 1,135 |
| Average household size | 2.81 |
| Average family size | 3.39 |
Economic characteristics in EL CAMPO, TX
| Total households | 4,104 |
| Less than $10,000 | 198 |
| $10,000 to $14,999 | 219 |
| $15,000 to $24,999 | 544 |
| $25,000 to $34,999 | 430 |
| $35,000 to $49,999 | 649 |
| $50,000 to $74,999 | 728 |
| $75,000 to $99,999 | 416 |
| $100,000 to $149,999 | 638 |
| $150,000 to $199,999 | 149 |
| $200,000 or more | 133 |
| Median household income (dollars) | 50,526 |
Housing characteristics in EL CAMPO, TX
| Total housing units | 4,525 |
| Occupied housing units | 4,104 |
| Vacant housing units | 421 |
| Total housing units | 4,525 |
| 1-unit, detached | 3,510 |
| 1-unit, attached | 46 |
| 2 units | 288 |
| 3 or 4 units | 146 |
| 5 to 9 units | 118 |
| 10 to 19 units | 45 |
| 20 or more units | 80 |
| Mobile home | 292 |
| Boat, RV, van, etc. | 0 |
| Total housing units | 4,525 |
| Built 2014 or later | 80 |
| Built 2010 to 2013 | 125 |
| Built 2000 to 2009 | 460 |
| Built 1990 to 1999 | 275 |
| Built 1980 to 1989 | 630 |
| Built 1970 to 1979 | 688 |
| Built 1960 to 1969 | 633 |
| Built 1950 to 1959 | 846 |
| Built 1940 to 1949 | 450 |
| Built 1939 or earlier | 338 |
| Total housing units | 4,525 |
| 1 room | 42 |
| 2 rooms | 20 |
| 3 rooms | 397 |
| 4 rooms | 856 |
| 5 rooms | 1,018 |
| 6 rooms | 964 |
| 7 rooms | 578 |
| 8 rooms | 297 |
| 9 rooms or more | 353 |
| Median rooms | 5.4 |
| Total housing units | 4,525 |
| No bedroom | 42 |
| 1 bedroom | 339 |
| 2 bedrooms | 1,444 |
| 3 bedrooms | 1,926 |
| 4 bedrooms | 659 |
| 5 or more bedrooms | 115 |
| Occupied housing units | 4,104 |
| Owner-occupied | 2,412 |
| Renter-occupied | 1,692 |
| Average household size of owner-occupied unit | 2.63 |
| Average household size of renter-occupied unit | 3.08 |
| Occupied housing units | 4,104 |
| Moved in 2017 or later | 149 |
| Moved in 2015 to 2016 | 503 |
| Moved in 2010 to 2014 | 967 |
| Moved in 2000 to 2009 | 1,173 |
| Moved in 1990 to 1999 | 536 |
| Moved in 1989 and earlier | 776 |
| Owner-occupied units | 2,412 |
| Less than $50,000 | 309 |
| $50,000 to $99,999 | 554 |
| $100,000 to $149,999 | 400 |
| $150,000 to $199,999 | 509 |
| $200,000 to $299,999 | 463 |
| $300,000 to $499,999 | 155 |
| $500,000 to $999,999 | 0 |
| $1,000,000 or more | 22 |
| Median (dollars) | 140,200 |
| Owner-occupied units | 2,412 |
| Housing units with a mortgage | 1,074 |
| Housing units without a mortgage | 1,338 |
| Occupied units paying rent | 1,542 |
| Less than $500 | 357 |
| $500 to $999 | 708 |
| $1,000 to $1,499 | 454 |
| $1,500 to $1,999 | 23 |
| $2,000 to $2,499 | 0 |
| $2,500 to $2,999 | 0 |
| $3,000 or more | 0 |
| Median (dollars) | 774 |
| No rent paid | 150 |
Data is based on 2018 Census
ZIP Codes for other locations
State for EL CAMPO
Texas ZIP CodesOther cities in Texas