FLOWER MOUND, TX ZIP Code
| City | FLOWER MOUND |
| State | Texas |
| ZIP Codes count | 4 (see all) |
| Post offices count | 2 (see all) |
| Total population | 73,252 (see all) |
ZIP Codes in FLOWER MOUND, Texas
The ZIP Codes in FLOWER MOUND, Texas fall within the range from 75022 to 75077. FLOWER MOUND is covered by 4 ZIP Codes: 3 Standard and 1 PO Box. Below is the complete list:
75022, 75027, 75028, 75077
This list contains only 5-digit ZIP codes. Use our zip code lookup by address feature to get the full 9-digit (ZIP+4) code.
List of FLOWER MOUND, TX ZIP Codes
| ZIP | TYPE | POPU |
|---|---|---|
| 75022 | STANDARD | 26,543 |
| 75027 | PO BOX | – |
| 75028 | STANDARD | 46,934 |
| 75077 | STANDARD | 39,125 |
Post offices
FLOWER MOUND — Post Office™ 2300 OLYMPIA DR FLOWER MOUND, TX 75028-9998 |
LEWISVILLE — Post Office™ 194 CIVIC CIR LEWISVILLE, TX 75067-9998 |
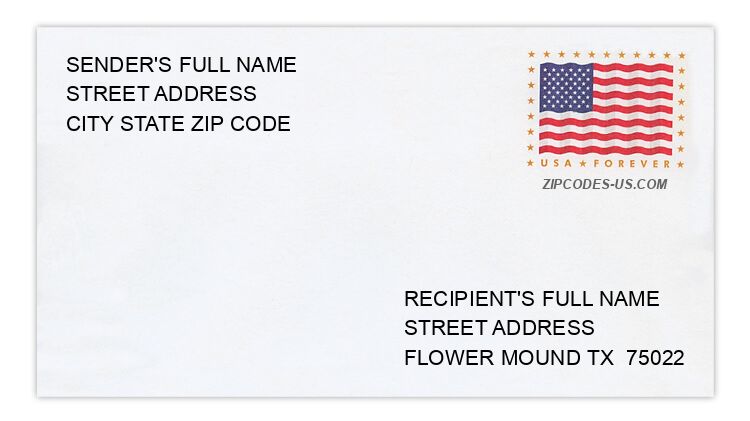
Envelope example
On the bottom center of the envelope, write the address you want your letter delivered to. Include the following on separate lines:
- Recipient's full name
- Full street address
- City, State, and ZIP Code
Using the same format, write the return address in the top left corner.
Using the full ZIP+4 Code when mailing via the USPS ensures the fastest, most accurate mailing possible. If you are not sure of the full 9-digit ZIP Code, use the 5-digit ZIP Code to avoid loss of letter or package.
The recipient address information is provided for your reference.
Address example
1094 BLUSTERY CT
FLOWER MOUND TX 75028-1340
FLOWER MOUND TX 75028-1340
452 BRIDGEWATER PL
FLOWER MOUND TX 75028-5111
FLOWER MOUND TX 75028-5111
6745 GREEN BRIAR LN
FLOWER MOUND TX 75022-5826
FLOWER MOUND TX 75022-5826
1794 MARIAN LN
FLOWER MOUND TX 75028-3543
FLOWER MOUND TX 75028-3543
631 PINTAIL PL
FLOWER MOUND TX 75028-7122
FLOWER MOUND TX 75028-7122
1290 ROYAL CT
FLOWER MOUND TX 75028-3586
FLOWER MOUND TX 75028-3586
Map
Hover over the map to see the ZIP code
Census data for FLOWER MOUND, TX
Demographic and housing estimates in FLOWER MOUND, TX
| Total population | 73,252 |
| Male | 36,008 |
| Female | 37,244 |
| Total population | 73,252 |
| Under 5 years | 4,337 |
| 5 to 9 years | 5,252 |
| 10 to 14 years | 6,700 |
| 15 to 19 years | 5,658 |
| 20 to 24 years | 3,264 |
| 25 to 34 years | 6,570 |
| 35 to 44 years | 10,836 |
| 45 to 54 years | 14,426 |
| 55 to 59 years | 5,964 |
| 60 to 64 years | 3,593 |
| 65 to 74 years | 4,618 |
| 75 to 84 years | 1,659 |
| 85 years and over | 375 |
| Median age (years) | 40.1 |
| Under 18 years | 20,300 |
| 16 years and over | 55,696 |
| 18 years and over | 52,952 |
| 21 years and over | 50,430 |
| 62 years and over | 8,566 |
| 65 years and over | 6,652 |
| Total population | 73,252 |
| One race | 70,992 |
| White | 58,564 |
| Black or African American | 2,985 |
| American Indian and Alaska Native | 328 |
| Asian | 7,972 |
| Native Hawaiian and Other Pacific Islander | 24 |
| Some other race | 1,119 |
| Two or more races | 2,260 |
| Citizen, VOTING AGE 18 and over population | 49,586 |
| Male Citizen, VOTING AGE 18 and over population | 24,171 |
| Female Citizen, VOTING AGE 18 and over population | 25,415 |
Social characteristics in FLOWER MOUND, TX
| Total households | 24,033 |
| Family households (families) | 20,711 |
| Married-couple family | 18,247 |
| Male householder, no wife present, family | 623 |
| Female householder, no husband present, family | 1,841 |
| Nonfamily households | 3,322 |
| Average household size | 3.04 |
| Average family size | 3.30 |
Economic characteristics in FLOWER MOUND, TX
| Total households | 24,033 |
| Less than $10,000 | 289 |
| $10,000 to $14,999 | 222 |
| $15,000 to $24,999 | 509 |
| $25,000 to $34,999 | 698 |
| $35,000 to $49,999 | 1,371 |
| $50,000 to $74,999 | 2,408 |
| $75,000 to $99,999 | 2,456 |
| $100,000 to $149,999 | 5,784 |
| $150,000 to $199,999 | 4,253 |
| $200,000 or more | 6,043 |
| Median household income (dollars) | 134,184 |
Housing characteristics in FLOWER MOUND, TX
| Total housing units | 24,754 |
| Occupied housing units | 24,033 |
| Vacant housing units | 721 |
| Total housing units | 24,754 |
| 1-unit, detached | 22,631 |
| 1-unit, attached | 281 |
| 2 units | 7 |
| 3 or 4 units | 117 |
| 5 to 9 units | 187 |
| 10 to 19 units | 443 |
| 20 or more units | 754 |
| Mobile home | 301 |
| Boat, RV, van, etc. | 33 |
| Total housing units | 24,754 |
| Built 2014 or later | 1,217 |
| Built 2010 to 2013 | 933 |
| Built 2000 to 2009 | 4,833 |
| Built 1990 to 1999 | 11,936 |
| Built 1980 to 1989 | 4,255 |
| Built 1970 to 1979 | 1,022 |
| Built 1960 to 1969 | 272 |
| Built 1950 to 1959 | 136 |
| Built 1940 to 1949 | 100 |
| Built 1939 or earlier | 50 |
| Total housing units | 24,754 |
| 1 room | 155 |
| 2 rooms | 292 |
| 3 rooms | 496 |
| 4 rooms | 831 |
| 5 rooms | 2,278 |
| 6 rooms | 2,869 |
| 7 rooms | 3,638 |
| 8 rooms | 4,316 |
| 9 rooms or more | 9,879 |
| Median rooms | 7.9 |
| Total housing units | 24,754 |
| No bedroom | 190 |
| 1 bedroom | 636 |
| 2 bedrooms | 1,349 |
| 3 bedrooms | 7,565 |
| 4 bedrooms | 11,713 |
| 5 or more bedrooms | 3,301 |
| Occupied housing units | 24,033 |
| Owner-occupied | 20,766 |
| Renter-occupied | 3,267 |
| Average household size of owner-occupied unit | 3.10 |
| Average household size of renter-occupied unit | 2.64 |
| Occupied housing units | 24,033 |
| Moved in 2017 or later | 1,073 |
| Moved in 2015 to 2016 | 3,198 |
| Moved in 2010 to 2014 | 6,546 |
| Moved in 2000 to 2009 | 8,160 |
| Moved in 1990 to 1999 | 4,166 |
| Moved in 1989 and earlier | 890 |
| Owner-occupied units | 20,766 |
| Less than $50,000 | 259 |
| $50,000 to $99,999 | 135 |
| $100,000 to $149,999 | 597 |
| $150,000 to $199,999 | 1,589 |
| $200,000 to $299,999 | 5,379 |
| $300,000 to $499,999 | 9,207 |
| $500,000 to $999,999 | 3,258 |
| $1,000,000 or more | 342 |
| Median (dollars) | 342,200 |
| Owner-occupied units | 20,766 |
| Housing units with a mortgage | 16,191 |
| Housing units without a mortgage | 4,575 |
| Occupied units paying rent | 3,118 |
| Less than $500 | 19 |
| $500 to $999 | 389 |
| $1,000 to $1,499 | 787 |
| $1,500 to $1,999 | 1,141 |
| $2,000 to $2,499 | 504 |
| $2,500 to $2,999 | 122 |
| $3,000 or more | 156 |
| Median (dollars) | 1,660 |
| No rent paid | 149 |
Data is based on 2018 Census
ZIP Codes for other locations
State for FLOWER MOUND
Texas ZIP CodesOther cities in Texas