FRISCO, TX ZIP Code
| City | FRISCO |
| State | Texas |
| ZIP Codes count | 4 (see all) |
| Post offices count | 2 (see all) |
| Total population | 165,700 (see all) |
ZIP Codes in FRISCO, Texas
The ZIP Codes in FRISCO, Texas fall within the range from 75033 to 75036. FRISCO is covered by 4 ZIP Codes: 4 Standard. Below is the complete list:
75033, 75034, 75035, 75036
This list contains only 5-digit ZIP codes. Use our zip code lookup by address feature to get the full 9-digit (ZIP+4) code.
List of FRISCO, TX ZIP Codes
| ZIP | TYPE | POPU |
|---|---|---|
| 75033 | STANDARD | – |
| 75034 | STANDARD | 45,759 |
| 75035 | STANDARD | 81,512 |
| 75036 | STANDARD | – |
Post offices
FRISCO — Post Office™ 8700 STONEBROOK PKWY FRISCO, TX 75034-9998 |
TEEL VILLAGE — Post Office™ 8811 TEEL PKWY STE 100 FRISCO, TX 75036-9997 |
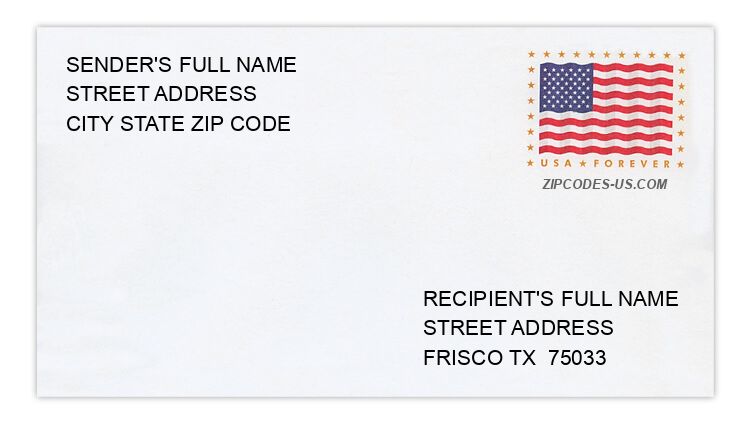
Envelope example
On the bottom center of the envelope, write the address you want your letter delivered to. Include the following on separate lines:
- Recipient's full name
- Full street address
- City, State, and ZIP Code
Using the same format, write the return address in the top left corner.
Using the full ZIP+4 Code when mailing via the USPS ensures the fastest, most accurate mailing possible. If you are not sure of the full 9-digit ZIP Code, use the 5-digit ZIP Code to avoid loss of letter or package.
The recipient address information is provided for your reference.
Address example
7821 EXCALIBER RD
FRISCO TX 75035-6762
FRISCO TX 75035-6762
5794 FRISCO SQUARE BLVD
FRISCO TX 75034-3324
FRISCO TX 75034-3324
1591 PRINCE WILLIAM LN
FRISCO TX 75034-6935
FRISCO TX 75034-6935
11172 ROGERS RD
FRISCO TX 75033-2470
FRISCO TX 75033-2470
4969 STILLWATER TRL
FRISCO TX 75034-4065
FRISCO TX 75034-4065
12757 WINDING CREEK DR
FRISCO TX 75035-1668
FRISCO TX 75035-1668
Map
Hover over the map to see the ZIP code
Census data for FRISCO, TX
Demographic and housing estimates in FRISCO, TX
| Total population | 165,700 |
| Male | 81,601 |
| Female | 84,099 |
| Total population | 165,700 |
| Under 5 years | 10,105 |
| 5 to 9 years | 15,258 |
| 10 to 14 years | 17,755 |
| 15 to 19 years | 12,620 |
| 20 to 24 years | 6,709 |
| 25 to 34 years | 15,415 |
| 35 to 44 years | 33,295 |
| 45 to 54 years | 28,434 |
| 55 to 59 years | 7,592 |
| 60 to 64 years | 5,744 |
| 65 to 74 years | 8,456 |
| 75 to 84 years | 3,443 |
| 85 years and over | 874 |
| Median age (years) | 36.9 |
| Under 18 years | 52,335 |
| 16 years and over | 118,931 |
| 18 years and over | 113,365 |
| 21 years and over | 108,614 |
| 62 years and over | 16,005 |
| 65 years and over | 12,773 |
| Total population | 165,700 |
| One race | 159,756 |
| White | 111,424 |
| Black or African American | 13,045 |
| American Indian and Alaska Native | 799 |
| Asian | 31,197 |
| Native Hawaiian and Other Pacific Islander | 63 |
| Some other race | 3,228 |
| Two or more races | 5,944 |
| Citizen, VOTING AGE 18 and over population | 98,338 |
| Male Citizen, VOTING AGE 18 and over population | 48,069 |
| Female Citizen, VOTING AGE 18 and over population | 50,269 |
Social characteristics in FRISCO, TX
| Total households | 55,827 |
| Family households (families) | 44,048 |
| Married-couple family | 38,118 |
| Male householder, no wife present, family | 1,679 |
| Female householder, no husband present, family | 4,251 |
| Nonfamily households | 11,779 |
| Average household size | 2.96 |
| Average family size | 3.40 |
Economic characteristics in FRISCO, TX
| Total households | 55,827 |
| Less than $10,000 | 1,142 |
| $10,000 to $14,999 | 541 |
| $15,000 to $24,999 | 1,735 |
| $25,000 to $34,999 | 1,940 |
| $35,000 to $49,999 | 3,829 |
| $50,000 to $74,999 | 5,985 |
| $75,000 to $99,999 | 6,134 |
| $100,000 to $149,999 | 12,128 |
| $150,000 to $199,999 | 9,622 |
| $200,000 or more | 12,771 |
| Median household income (dollars) | 127,133 |
Housing characteristics in FRISCO, TX
| Total housing units | 59,273 |
| Occupied housing units | 55,827 |
| Vacant housing units | 3,446 |
| Total housing units | 59,273 |
| 1-unit, detached | 45,941 |
| 1-unit, attached | 1,206 |
| 2 units | 337 |
| 3 or 4 units | 652 |
| 5 to 9 units | 1,188 |
| 10 to 19 units | 2,964 |
| 20 or more units | 6,634 |
| Mobile home | 329 |
| Boat, RV, van, etc. | 22 |
| Total housing units | 59,273 |
| Built 2014 or later | 6,642 |
| Built 2010 to 2013 | 8,433 |
| Built 2000 to 2009 | 27,798 |
| Built 1990 to 1999 | 12,532 |
| Built 1980 to 1989 | 1,886 |
| Built 1970 to 1979 | 800 |
| Built 1960 to 1969 | 512 |
| Built 1950 to 1959 | 204 |
| Built 1940 to 1949 | 168 |
| Built 1939 or earlier | 298 |
| Total housing units | 59,273 |
| 1 room | 800 |
| 2 rooms | 2,387 |
| 3 rooms | 4,155 |
| 4 rooms | 3,732 |
| 5 rooms | 5,667 |
| 6 rooms | 6,390 |
| 7 rooms | 6,720 |
| 8 rooms | 7,060 |
| 9 rooms or more | 22,362 |
| Median rooms | 7.5 |
| Total housing units | 59,273 |
| No bedroom | 882 |
| 1 bedroom | 6,168 |
| 2 bedrooms | 6,239 |
| 3 bedrooms | 14,581 |
| 4 bedrooms | 19,550 |
| 5 or more bedrooms | 11,853 |
| Occupied housing units | 55,827 |
| Owner-occupied | 41,246 |
| Renter-occupied | 14,581 |
| Average household size of owner-occupied unit | 3.19 |
| Average household size of renter-occupied unit | 2.31 |
| Occupied housing units | 55,827 |
| Moved in 2017 or later | 3,812 |
| Moved in 2015 to 2016 | 9,891 |
| Moved in 2010 to 2014 | 20,074 |
| Moved in 2000 to 2009 | 18,799 |
| Moved in 1990 to 1999 | 2,840 |
| Moved in 1989 and earlier | 411 |
| Owner-occupied units | 41,246 |
| Less than $50,000 | 511 |
| $50,000 to $99,999 | 197 |
| $100,000 to $149,999 | 584 |
| $150,000 to $199,999 | 2,407 |
| $200,000 to $299,999 | 9,644 |
| $300,000 to $499,999 | 18,742 |
| $500,000 to $999,999 | 8,287 |
| $1,000,000 or more | 874 |
| Median (dollars) | 368,000 |
| Owner-occupied units | 41,246 |
| Housing units with a mortgage | 32,973 |
| Housing units without a mortgage | 8,273 |
| Occupied units paying rent | 14,284 |
| Less than $500 | 83 |
| $500 to $999 | 1,397 |
| $1,000 to $1,499 | 6,186 |
| $1,500 to $1,999 | 3,620 |
| $2,000 to $2,499 | 2,052 |
| $2,500 to $2,999 | 611 |
| $3,000 or more | 335 |
| Median (dollars) | 1,441 |
| No rent paid | 297 |
Data is based on 2018 Census
ZIP Codes for other locations
State for FRISCO
Texas ZIP CodesOther cities in Texas