GRAHAM, TX ZIP Code
| City | GRAHAM |
| State | Texas |
| ZIP Codes count | 1 (see all) |
| Post offices count | 1 (see all) |
| Total population | 8,746 (see all) |
ZIP Code in GRAHAM, Texas
76450
This list contains only 5-digit ZIP codes. Use our zip code lookup by address feature to get the full 9-digit (ZIP+4) code.
List of GRAHAM, TX ZIP Codes
| ZIP | TYPE | POPU |
|---|---|---|
| 76450 | STANDARD | 13,090 |
Post offices
GRAHAM — Post Office™ 100 TENNESSEE ST GRAHAM, TX 76450-2243 |
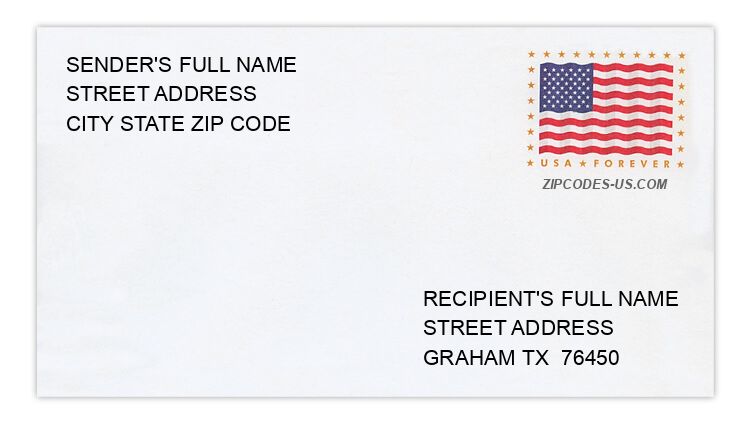
Envelope example
On the bottom center of the envelope, write the address you want your letter delivered to. Include the following on separate lines:
- Recipient's full name
- Full street address
- City, State, and ZIP Code
Using the same format, write the return address in the top left corner.
Using the full ZIP+4 Code when mailing via the USPS ensures the fastest, most accurate mailing possible. If you are not sure of the full 9-digit ZIP Code, use the 5-digit ZIP Code to avoid loss of letter or package.
The recipient address information is provided for your reference.
Address example
328 BIRDWELL RD
GRAHAM TX 76450-6550
GRAHAM TX 76450-6550
2137 CHEROKEE LOOP
GRAHAM TX 76450-4737
GRAHAM TX 76450-4737
4773 FOX HOLLOW RD
GRAHAM TX 76450-5821
GRAHAM TX 76450-5821
1285 PACKING HOUSE RD
GRAHAM TX 76450-3820
GRAHAM TX 76450-3820
510 SOUTH ST
GRAHAM TX 76450-3430
GRAHAM TX 76450-3430
13450 STEPHENS COUNTY ROAD 166
GRAHAM TX 76450-5291
GRAHAM TX 76450-5291
Map
Hover over the map to see the ZIP code
Census data for GRAHAM, TX
Demographic and housing estimates in GRAHAM, TX
| Total population | 8,746 |
| Male | 4,235 |
| Female | 4,511 |
| Total population | 8,746 |
| Under 5 years | 684 |
| 5 to 9 years | 547 |
| 10 to 14 years | 679 |
| 15 to 19 years | 647 |
| 20 to 24 years | 470 |
| 25 to 34 years | 1,084 |
| 35 to 44 years | 888 |
| 45 to 54 years | 1,280 |
| 55 to 59 years | 426 |
| 60 to 64 years | 554 |
| 65 to 74 years | 622 |
| 75 to 84 years | 514 |
| 85 years and over | 351 |
| Median age (years) | 38.4 |
| Under 18 years | 2,354 |
| 16 years and over | 6,624 |
| 18 years and over | 6,392 |
| 21 years and over | 6,101 |
| 62 years and over | 1,737 |
| 65 years and over | 1,487 |
| Total population | 8,746 |
| One race | 8,746 |
| White | 8,177 |
| Black or African American | 220 |
| American Indian and Alaska Native | 48 |
| Asian | 85 |
| Native Hawaiian and Other Pacific Islander | 0 |
| Some other race | 216 |
| Two or more races | 0 |
| Citizen, VOTING AGE 18 and over population | 5,942 |
| Male Citizen, VOTING AGE 18 and over population | 2,886 |
| Female Citizen, VOTING AGE 18 and over population | 3,056 |
Social characteristics in GRAHAM, TX
| Total households | 3,365 |
| Family households (families) | 2,482 |
| Married-couple family | 1,716 |
| Male householder, no wife present, family | 318 |
| Female householder, no husband present, family | 448 |
| Nonfamily households | 883 |
| Average household size | 2.56 |
| Average family size | 2.93 |
Economic characteristics in GRAHAM, TX
| Total households | 3,365 |
| Less than $10,000 | 217 |
| $10,000 to $14,999 | 179 |
| $15,000 to $24,999 | 331 |
| $25,000 to $34,999 | 450 |
| $35,000 to $49,999 | 882 |
| $50,000 to $74,999 | 498 |
| $75,000 to $99,999 | 228 |
| $100,000 to $149,999 | 456 |
| $150,000 to $199,999 | 73 |
| $200,000 or more | 51 |
| Median household income (dollars) | 41,875 |
Housing characteristics in GRAHAM, TX
| Total housing units | 3,932 |
| Occupied housing units | 3,365 |
| Vacant housing units | 567 |
| Total housing units | 3,932 |
| 1-unit, detached | 3,373 |
| 1-unit, attached | 94 |
| 2 units | 56 |
| 3 or 4 units | 0 |
| 5 to 9 units | 178 |
| 10 to 19 units | 85 |
| 20 or more units | 20 |
| Mobile home | 126 |
| Boat, RV, van, etc. | 0 |
| Total housing units | 3,932 |
| Built 2014 or later | 7 |
| Built 2010 to 2013 | 181 |
| Built 2000 to 2009 | 350 |
| Built 1990 to 1999 | 155 |
| Built 1980 to 1989 | 514 |
| Built 1970 to 1979 | 374 |
| Built 1960 to 1969 | 487 |
| Built 1950 to 1959 | 1,283 |
| Built 1940 to 1949 | 248 |
| Built 1939 or earlier | 333 |
| Total housing units | 3,932 |
| 1 room | 56 |
| 2 rooms | 48 |
| 3 rooms | 92 |
| 4 rooms | 644 |
| 5 rooms | 1,151 |
| 6 rooms | 1,000 |
| 7 rooms | 563 |
| 8 rooms | 262 |
| 9 rooms or more | 116 |
| Median rooms | 5.5 |
| Total housing units | 3,932 |
| No bedroom | 63 |
| 1 bedroom | 174 |
| 2 bedrooms | 1,104 |
| 3 bedrooms | 2,149 |
| 4 bedrooms | 442 |
| 5 or more bedrooms | 0 |
| Occupied housing units | 3,365 |
| Owner-occupied | 2,526 |
| Renter-occupied | 839 |
| Average household size of owner-occupied unit | 2.58 |
| Average household size of renter-occupied unit | 2.48 |
| Occupied housing units | 3,365 |
| Moved in 2017 or later | 162 |
| Moved in 2015 to 2016 | 421 |
| Moved in 2010 to 2014 | 929 |
| Moved in 2000 to 2009 | 1,010 |
| Moved in 1990 to 1999 | 340 |
| Moved in 1989 and earlier | 503 |
| Owner-occupied units | 2,526 |
| Less than $50,000 | 498 |
| $50,000 to $99,999 | 1,126 |
| $100,000 to $149,999 | 520 |
| $150,000 to $199,999 | 203 |
| $200,000 to $299,999 | 75 |
| $300,000 to $499,999 | 104 |
| $500,000 to $999,999 | 0 |
| $1,000,000 or more | 0 |
| Median (dollars) | 87,200 |
| Owner-occupied units | 2,526 |
| Housing units with a mortgage | 1,181 |
| Housing units without a mortgage | 1,345 |
| Occupied units paying rent | 708 |
| Less than $500 | 57 |
| $500 to $999 | 565 |
| $1,000 to $1,499 | 71 |
| $1,500 to $1,999 | 15 |
| $2,000 to $2,499 | 0 |
| $2,500 to $2,999 | 0 |
| $3,000 or more | 0 |
| Median (dollars) | 707 |
| No rent paid | 131 |
Data is based on 2018 Census
ZIP Codes for other locations
State for GRAHAM
Texas ZIP CodesOther cities in Texas