GRANGER, TX ZIP Code
| City | GRANGER |
| State | Texas |
| ZIP Codes count | 1 (see all) |
| Post offices count | 2 (see all) |
| Total population | 1,321 (see all) |
ZIP Code in GRANGER, Texas
76530
This list contains only 5-digit ZIP codes. Use our zip code lookup by address feature to get the full 9-digit (ZIP+4) code.
List of GRANGER, TX ZIP Codes
| ZIP | TYPE | POPU |
|---|---|---|
| 76530 | STANDARD | 2,277 |
Post offices
BARTLETT — Post Office™ 131 N EVIE ST BARTLETT, TX 76511-9998 |
GRANGER — Post Office™ 117 W DAVILLA ST GRANGER, TX 76530-9998 |
Envelope example
On the bottom center of the envelope, write the address you want your letter delivered to. Include the following on separate lines:
- Recipient's full name
- Full street address
- City, State, and ZIP Code
Using the same format, write the return address in the top left corner.
Using the full ZIP+4 Code when mailing via the USPS ensures the fastest, most accurate mailing possible. If you are not sure of the full 9-digit ZIP Code, use the 5-digit ZIP Code to avoid loss of letter or package.
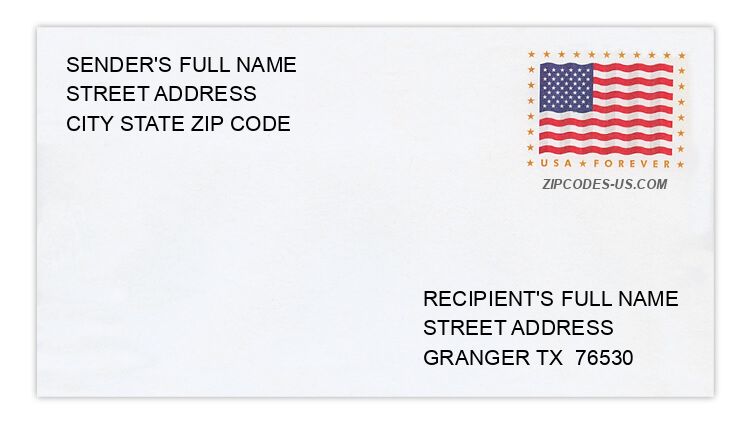
The recipient address information is provided for your reference.
Address example
723 COUNTY ROAD 161
GRANGER TX 76530-5163
GRANGER TX 76530-5163
232 COUNTY ROAD 328
GRANGER TX 76530-5423
GRANGER TX 76530-5423
1028 COUNTY ROAD 363
GRANGER TX 76530-5323
GRANGER TX 76530-5323
3556 COUNTY ROAD 428
GRANGER TX 76530-5057
GRANGER TX 76530-5057
753 E FOX
GRANGER TX 76530-5353
GRANGER TX 76530-5353
290 S RIO GRANDE
GRANGER TX 76530-5555
GRANGER TX 76530-5555
Map
Hover over the map to see the ZIP code
Census data for GRANGER, TX
Demographic and housing estimates in GRANGER, TX
| Total population | 1,321 |
| Male | 741 |
| Female | 580 |
| Total population | 1,321 |
| Under 5 years | 66 |
| 5 to 9 years | 36 |
| 10 to 14 years | 65 |
| 15 to 19 years | 68 |
| 20 to 24 years | 106 |
| 25 to 34 years | 178 |
| 35 to 44 years | 195 |
| 45 to 54 years | 129 |
| 55 to 59 years | 97 |
| 60 to 64 years | 138 |
| 65 to 74 years | 93 |
| 75 to 84 years | 99 |
| 85 years and over | 51 |
| Median age (years) | 43.2 |
| Under 18 years | 203 |
| 16 years and over | 1,140 |
| 18 years and over | 1,118 |
| 21 years and over | 1,062 |
| 62 years and over | 338 |
| 65 years and over | 243 |
| Total population | 1,321 |
| One race | 1,290 |
| White | 1,164 |
| Black or African American | 94 |
| American Indian and Alaska Native | 0 |
| Asian | 0 |
| Native Hawaiian and Other Pacific Islander | 0 |
| Some other race | 32 |
| Two or more races | 31 |
| Citizen, VOTING AGE 18 and over population | 1,044 |
| Male Citizen, VOTING AGE 18 and over population | 588 |
| Female Citizen, VOTING AGE 18 and over population | 456 |
Social characteristics in GRANGER, TX
| Total households | 433 |
| Family households (families) | 282 |
| Married-couple family | 233 |
| Male householder, no wife present, family | 17 |
| Female householder, no husband present, family | 32 |
| Nonfamily households | 151 |
| Average household size | 2.62 |
| Average family size | 3.30 |
Economic characteristics in GRANGER, TX
| Total households | 433 |
| Less than $10,000 | 38 |
| $10,000 to $14,999 | 23 |
| $15,000 to $24,999 | 59 |
| $25,000 to $34,999 | 51 |
| $35,000 to $49,999 | 92 |
| $50,000 to $74,999 | 31 |
| $75,000 to $99,999 | 26 |
| $100,000 to $149,999 | 66 |
| $150,000 to $199,999 | 30 |
| $200,000 or more | 17 |
| Median household income (dollars) | 42,928 |
Housing characteristics in GRANGER, TX
| Total housing units | 493 |
| Occupied housing units | 433 |
| Vacant housing units | 60 |
| Total housing units | 493 |
| 1-unit, detached | 359 |
| 1-unit, attached | 0 |
| 2 units | 19 |
| 3 or 4 units | 3 |
| 5 to 9 units | 0 |
| 10 to 19 units | 11 |
| 20 or more units | 14 |
| Mobile home | 87 |
| Boat, RV, van, etc. | 0 |
| Total housing units | 493 |
| Built 2014 or later | 0 |
| Built 2010 to 2013 | 30 |
| Built 2000 to 2009 | 13 |
| Built 1990 to 1999 | 64 |
| Built 1980 to 1989 | 53 |
| Built 1970 to 1979 | 79 |
| Built 1960 to 1969 | 29 |
| Built 1950 to 1959 | 74 |
| Built 1940 to 1949 | 52 |
| Built 1939 or earlier | 99 |
| Total housing units | 493 |
| 1 room | 7 |
| 2 rooms | 2 |
| 3 rooms | 28 |
| 4 rooms | 92 |
| 5 rooms | 153 |
| 6 rooms | 122 |
| 7 rooms | 44 |
| 8 rooms | 30 |
| 9 rooms or more | 15 |
| Median rooms | 5.3 |
| Total housing units | 493 |
| No bedroom | 7 |
| 1 bedroom | 23 |
| 2 bedrooms | 184 |
| 3 bedrooms | 230 |
| 4 bedrooms | 33 |
| 5 or more bedrooms | 16 |
| Occupied housing units | 433 |
| Owner-occupied | 297 |
| Renter-occupied | 136 |
| Average household size of owner-occupied unit | 2.60 |
| Average household size of renter-occupied unit | 2.65 |
| Occupied housing units | 433 |
| Moved in 2017 or later | 18 |
| Moved in 2015 to 2016 | 29 |
| Moved in 2010 to 2014 | 151 |
| Moved in 2000 to 2009 | 111 |
| Moved in 1990 to 1999 | 31 |
| Moved in 1989 and earlier | 93 |
| Owner-occupied units | 297 |
| Less than $50,000 | 27 |
| $50,000 to $99,999 | 152 |
| $100,000 to $149,999 | 41 |
| $150,000 to $199,999 | 62 |
| $200,000 to $299,999 | 15 |
| $300,000 to $499,999 | 0 |
| $500,000 to $999,999 | 0 |
| $1,000,000 or more | 0 |
| Median (dollars) | 90,200 |
| Owner-occupied units | 297 |
| Housing units with a mortgage | 126 |
| Housing units without a mortgage | 171 |
| Occupied units paying rent | 133 |
| Less than $500 | 32 |
| $500 to $999 | 65 |
| $1,000 to $1,499 | 31 |
| $1,500 to $1,999 | 5 |
| $2,000 to $2,499 | 0 |
| $2,500 to $2,999 | 0 |
| $3,000 or more | 0 |
| Median (dollars) | 766 |
| No rent paid | 3 |
Data is based on 2018 Census
ZIP Codes for other locations
State for GRANGER
Texas ZIP CodesOther cities in Texas