GROVES, TX ZIP Code
| City | GROVES |
| State | Texas |
| ZIP Codes count | 1 (see all) |
| Post offices count | 1 (see all) |
| Total population | 15,760 (see all) |
ZIP Code in GROVES, Texas
77619
This list contains only 5-digit ZIP codes. Use our zip code lookup by address feature to get the full 9-digit (ZIP+4) code.
List of GROVES, TX ZIP Codes
| ZIP | TYPE | POPU |
|---|---|---|
| 77619 | STANDARD | 17,078 |
Post offices
GROVES — Post Office™ 6230 39TH ST GROVES, TX 77619-9998 |
Envelope example
On the bottom center of the envelope, write the address you want your letter delivered to. Include the following on separate lines:
- Recipient's full name
- Full street address
- City, State, and ZIP Code
Using the same format, write the return address in the top left corner.
Using the full ZIP+4 Code when mailing via the USPS ensures the fastest, most accurate mailing possible. If you are not sure of the full 9-digit ZIP Code, use the 5-digit ZIP Code to avoid loss of letter or package.
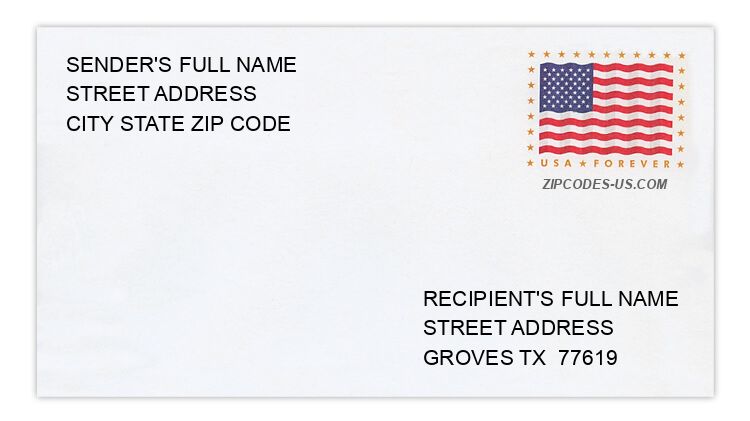
The recipient address information is provided for your reference.
Address example
4585 KAREN LN
GROVES TX 77619-37ND
GROVES TX 77619-37ND
2704 MONTROSE AVE
GROVES TX 77619-2631
GROVES TX 77619-2631
6624 SHERWOOD LN
GROVES TX 77619-4941
GROVES TX 77619-4941
5592 SONNIER LN
GROVES TX 77619-32ND
GROVES TX 77619-32ND
5977 W MADISON ST
GROVES TX 77619-4707
GROVES TX 77619-4707
5292 WHITAKER ST
GROVES TX 77619-3242
GROVES TX 77619-3242
Map
Hover over the map to see the ZIP code
Census data for GROVES, TX
Demographic and housing estimates in GROVES, TX
| Total population | 15,760 |
| Male | 7,837 |
| Female | 7,923 |
| Total population | 15,760 |
| Under 5 years | 885 |
| 5 to 9 years | 1,069 |
| 10 to 14 years | 1,095 |
| 15 to 19 years | 1,004 |
| 20 to 24 years | 879 |
| 25 to 34 years | 2,453 |
| 35 to 44 years | 1,677 |
| 45 to 54 years | 2,028 |
| 55 to 59 years | 1,108 |
| 60 to 64 years | 962 |
| 65 to 74 years | 1,180 |
| 75 to 84 years | 1,021 |
| 85 years and over | 399 |
| Median age (years) | 37.9 |
| Under 18 years | 3,752 |
| 16 years and over | 12,556 |
| 18 years and over | 12,008 |
| 21 years and over | 11,581 |
| 62 years and over | 3,122 |
| 65 years and over | 2,600 |
| Total population | 15,760 |
| One race | 15,401 |
| White | 14,102 |
| Black or African American | 584 |
| American Indian and Alaska Native | 0 |
| Asian | 445 |
| Native Hawaiian and Other Pacific Islander | 16 |
| Some other race | 254 |
| Two or more races | 359 |
| Citizen, VOTING AGE 18 and over population | 11,210 |
| Male Citizen, VOTING AGE 18 and over population | 5,561 |
| Female Citizen, VOTING AGE 18 and over population | 5,649 |
Social characteristics in GROVES, TX
| Total households | 5,992 |
| Family households (families) | 3,968 |
| Married-couple family | 3,078 |
| Male householder, no wife present, family | 222 |
| Female householder, no husband present, family | 668 |
| Nonfamily households | 2,024 |
| Average household size | 2.60 |
| Average family size | 3.17 |
Economic characteristics in GROVES, TX
| Total households | 5,992 |
| Less than $10,000 | 363 |
| $10,000 to $14,999 | 294 |
| $15,000 to $24,999 | 519 |
| $25,000 to $34,999 | 454 |
| $35,000 to $49,999 | 971 |
| $50,000 to $74,999 | 1,221 |
| $75,000 to $99,999 | 877 |
| $100,000 to $149,999 | 892 |
| $150,000 to $199,999 | 247 |
| $200,000 or more | 154 |
| Median household income (dollars) | 54,288 |
Housing characteristics in GROVES, TX
| Total housing units | 6,648 |
| Occupied housing units | 5,992 |
| Vacant housing units | 656 |
| Total housing units | 6,648 |
| 1-unit, detached | 5,612 |
| 1-unit, attached | 121 |
| 2 units | 131 |
| 3 or 4 units | 47 |
| 5 to 9 units | 235 |
| 10 to 19 units | 338 |
| 20 or more units | 117 |
| Mobile home | 47 |
| Boat, RV, van, etc. | 0 |
| Total housing units | 6,648 |
| Built 2014 or later | 74 |
| Built 2010 to 2013 | 110 |
| Built 2000 to 2009 | 304 |
| Built 1990 to 1999 | 547 |
| Built 1980 to 1989 | 427 |
| Built 1970 to 1979 | 1,003 |
| Built 1960 to 1969 | 1,446 |
| Built 1950 to 1959 | 2,097 |
| Built 1940 to 1949 | 480 |
| Built 1939 or earlier | 160 |
| Total housing units | 6,648 |
| 1 room | 46 |
| 2 rooms | 97 |
| 3 rooms | 455 |
| 4 rooms | 968 |
| 5 rooms | 1,850 |
| 6 rooms | 1,747 |
| 7 rooms | 869 |
| 8 rooms | 349 |
| 9 rooms or more | 267 |
| Median rooms | 5.5 |
| Total housing units | 6,648 |
| No bedroom | 46 |
| 1 bedroom | 437 |
| 2 bedrooms | 1,821 |
| 3 bedrooms | 3,634 |
| 4 bedrooms | 649 |
| 5 or more bedrooms | 61 |
| Occupied housing units | 5,992 |
| Owner-occupied | 4,235 |
| Renter-occupied | 1,757 |
| Average household size of owner-occupied unit | 2.65 |
| Average household size of renter-occupied unit | 2.47 |
| Occupied housing units | 5,992 |
| Moved in 2017 or later | 360 |
| Moved in 2015 to 2016 | 955 |
| Moved in 2010 to 2014 | 1,381 |
| Moved in 2000 to 2009 | 1,497 |
| Moved in 1990 to 1999 | 759 |
| Moved in 1989 and earlier | 1,040 |
| Owner-occupied units | 4,235 |
| Less than $50,000 | 179 |
| $50,000 to $99,999 | 1,628 |
| $100,000 to $149,999 | 1,206 |
| $150,000 to $199,999 | 714 |
| $200,000 to $299,999 | 446 |
| $300,000 to $499,999 | 27 |
| $500,000 to $999,999 | 11 |
| $1,000,000 or more | 24 |
| Median (dollars) | 110,100 |
| Owner-occupied units | 4,235 |
| Housing units with a mortgage | 2,062 |
| Housing units without a mortgage | 2,173 |
| Occupied units paying rent | 1,609 |
| Less than $500 | 110 |
| $500 to $999 | 913 |
| $1,000 to $1,499 | 569 |
| $1,500 to $1,999 | 17 |
| $2,000 to $2,499 | 0 |
| $2,500 to $2,999 | 0 |
| $3,000 or more | 0 |
| Median (dollars) | 933 |
| No rent paid | 148 |
Data is based on 2018 Census
ZIP Codes for other locations
State for GROVES
Texas ZIP CodesOther cities in Texas