GUN BARREL CITY, TX ZIP Code
| City | GUN BARREL CITY |
| State | Texas |
| ZIP Codes count | 2 (see all) |
| Post offices count | 1 (see all) |
| Total population | 6,057 (see all) |
ZIP Codes in GUN BARREL CITY, Texas
75147, 75156
This list contains only 5-digit ZIP codes. Use our zip code lookup by address feature to get the full 9-digit (ZIP+4) code.
List of GUN BARREL CITY, TX ZIP Codes
| ZIP | TYPE | POPU |
|---|---|---|
| 75147 | STANDARD | 6,922 |
| 75156 | STANDARD | 16,500 |
Post offices
MABANK — Post Office™ 1401 S 3RD ST MABANK, TX 75147-9998 |
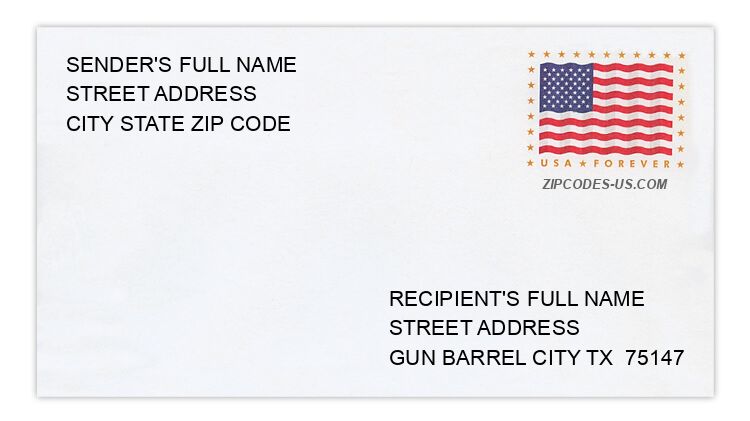
Envelope example
On the bottom center of the envelope, write the address you want your letter delivered to. Include the following on separate lines:
- Recipient's full name
- Full street address
- City, State, and ZIP Code
Using the same format, write the return address in the top left corner.
Using the full ZIP+4 Code when mailing via the USPS ensures the fastest, most accurate mailing possible. If you are not sure of the full 9-digit ZIP Code, use the 5-digit ZIP Code to avoid loss of letter or package.
The recipient address information is provided for your reference.
Address example
166 ALLEN ST
GUN BARREL CITY TX 75156-5153
GUN BARREL CITY TX 75156-5153
193 BOSHART WAY
GUN BARREL CITY TX 75156-4209
GUN BARREL CITY TX 75156-4209
150 COLD DUCK HOOK ST
GUN BARREL CITY TX 75156-3996
GUN BARREL CITY TX 75156-3996
261 N GUN BARREL LN
GUN BARREL CITY TX 75156-3727
GUN BARREL CITY TX 75156-3727
166 SUNNYMEADOW ST
GUN BARREL CITY TX 75156-3831
GUN BARREL CITY TX 75156-3831
225 WOODWIND ST
GUN BARREL CITY TX 75156-3935
GUN BARREL CITY TX 75156-3935
Map
Hover over the map to see the ZIP code
Census data for GUN BARREL CITY, TX
Demographic and housing estimates in GUN BARREL CITY, TX
| Total population | 6,057 |
| Male | 2,910 |
| Female | 3,147 |
| Total population | 6,057 |
| Under 5 years | 263 |
| 5 to 9 years | 208 |
| 10 to 14 years | 433 |
| 15 to 19 years | 520 |
| 20 to 24 years | 213 |
| 25 to 34 years | 518 |
| 35 to 44 years | 801 |
| 45 to 54 years | 662 |
| 55 to 59 years | 496 |
| 60 to 64 years | 526 |
| 65 to 74 years | 848 |
| 75 to 84 years | 487 |
| 85 years and over | 82 |
| Median age (years) | 47.1 |
| Under 18 years | 1,269 |
| 16 years and over | 5,053 |
| 18 years and over | 4,788 |
| 21 years and over | 4,581 |
| 62 years and over | 1,692 |
| 65 years and over | 1,417 |
| Total population | 6,057 |
| One race | 5,965 |
| White | 5,783 |
| Black or African American | 63 |
| American Indian and Alaska Native | 0 |
| Asian | 0 |
| Native Hawaiian and Other Pacific Islander | 0 |
| Some other race | 119 |
| Two or more races | 92 |
| Citizen, VOTING AGE 18 and over population | 4,732 |
| Male Citizen, VOTING AGE 18 and over population | 2,172 |
| Female Citizen, VOTING AGE 18 and over population | 2,560 |
Social characteristics in GUN BARREL CITY, TX
| Total households | 2,514 |
| Family households (families) | 1,639 |
| Married-couple family | 1,350 |
| Male householder, no wife present, family | 10 |
| Female householder, no husband present, family | 279 |
| Nonfamily households | 875 |
| Average household size | 2.41 |
| Average family size | 3.02 |
Economic characteristics in GUN BARREL CITY, TX
| Total households | 2,514 |
| Less than $10,000 | 196 |
| $10,000 to $14,999 | 198 |
| $15,000 to $24,999 | 269 |
| $25,000 to $34,999 | 367 |
| $35,000 to $49,999 | 418 |
| $50,000 to $74,999 | 321 |
| $75,000 to $99,999 | 296 |
| $100,000 to $149,999 | 256 |
| $150,000 to $199,999 | 112 |
| $200,000 or more | 81 |
| Median household income (dollars) | 41,911 |
Housing characteristics in GUN BARREL CITY, TX
| Total housing units | 3,134 |
| Occupied housing units | 2,514 |
| Vacant housing units | 620 |
| Total housing units | 3,134 |
| 1-unit, detached | 2,047 |
| 1-unit, attached | 42 |
| 2 units | 12 |
| 3 or 4 units | 89 |
| 5 to 9 units | 36 |
| 10 to 19 units | 0 |
| 20 or more units | 61 |
| Mobile home | 847 |
| Boat, RV, van, etc. | 0 |
| Total housing units | 3,134 |
| Built 2014 or later | 65 |
| Built 2010 to 2013 | 280 |
| Built 2000 to 2009 | 497 |
| Built 1990 to 1999 | 454 |
| Built 1980 to 1989 | 496 |
| Built 1970 to 1979 | 859 |
| Built 1960 to 1969 | 355 |
| Built 1950 to 1959 | 74 |
| Built 1940 to 1949 | 0 |
| Built 1939 or earlier | 54 |
| Total housing units | 3,134 |
| 1 room | 0 |
| 2 rooms | 46 |
| 3 rooms | 141 |
| 4 rooms | 713 |
| 5 rooms | 947 |
| 6 rooms | 576 |
| 7 rooms | 399 |
| 8 rooms | 163 |
| 9 rooms or more | 149 |
| Median rooms | 5.2 |
| Total housing units | 3,134 |
| No bedroom | 0 |
| 1 bedroom | 255 |
| 2 bedrooms | 975 |
| 3 bedrooms | 1,545 |
| 4 bedrooms | 288 |
| 5 or more bedrooms | 71 |
| Occupied housing units | 2,514 |
| Owner-occupied | 2,031 |
| Renter-occupied | 483 |
| Average household size of owner-occupied unit | 2.37 |
| Average household size of renter-occupied unit | 2.56 |
| Occupied housing units | 2,514 |
| Moved in 2017 or later | 145 |
| Moved in 2015 to 2016 | 248 |
| Moved in 2010 to 2014 | 893 |
| Moved in 2000 to 2009 | 671 |
| Moved in 1990 to 1999 | 388 |
| Moved in 1989 and earlier | 169 |
| Owner-occupied units | 2,031 |
| Less than $50,000 | 434 |
| $50,000 to $99,999 | 524 |
| $100,000 to $149,999 | 317 |
| $150,000 to $199,999 | 357 |
| $200,000 to $299,999 | 261 |
| $300,000 to $499,999 | 87 |
| $500,000 to $999,999 | 32 |
| $1,000,000 or more | 19 |
| Median (dollars) | 106,300 |
| Owner-occupied units | 2,031 |
| Housing units with a mortgage | 1,132 |
| Housing units without a mortgage | 899 |
| Occupied units paying rent | 412 |
| Less than $500 | 92 |
| $500 to $999 | 268 |
| $1,000 to $1,499 | 28 |
| $1,500 to $1,999 | 24 |
| $2,000 to $2,499 | 0 |
| $2,500 to $2,999 | 0 |
| $3,000 or more | 0 |
| Median (dollars) | 703 |
| No rent paid | 71 |
Data is based on 2018 Census
ZIP Codes for other locations
State for GUN BARREL CITY
Texas ZIP CodesOther cities in Texas