HONEY GROVE, TX ZIP Code
| City | HONEY GROVE |
| State | Texas |
| ZIP Codes count | 1 (see all) |
| Post offices count | 1 (see all) |
| Total population | 2,172 (see all) |
ZIP Code in HONEY GROVE, Texas
75446
This list contains only 5-digit ZIP codes. Use our zip code lookup by address feature to get the full 9-digit (ZIP+4) code.
List of HONEY GROVE, TX ZIP Codes
| ZIP | TYPE | POPU |
|---|---|---|
| 75446 | STANDARD | 3,536 |
Post offices
HONEY GROVE — Post Office™ 100 E MAIN ST HONEY GROVE, TX 75446-9998 |
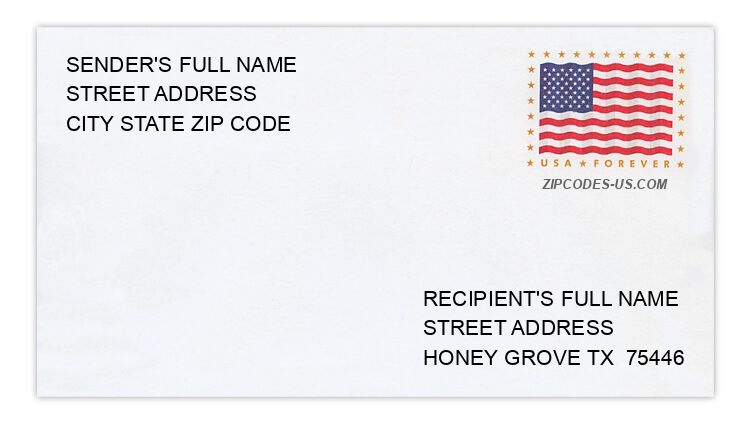
Envelope example
On the bottom center of the envelope, write the address you want your letter delivered to. Include the following on separate lines:
- Recipient's full name
- Full street address
- City, State, and ZIP Code
Using the same format, write the return address in the top left corner.
Using the full ZIP+4 Code when mailing via the USPS ensures the fastest, most accurate mailing possible. If you are not sure of the full 9-digit ZIP Code, use the 5-digit ZIP Code to avoid loss of letter or package.
The recipient address information is provided for your reference.
Address example
227 14TH ST
HONEY GROVE TX 75446-1213
HONEY GROVE TX 75446-1213
274 4TH ST
HONEY GROVE TX 75446-1418
HONEY GROVE TX 75446-1418
460 COUNTY ROAD 3490
HONEY GROVE TX 75446-6816
HONEY GROVE TX 75446-6816
14804 FARM ROAD 38 N
HONEY GROVE TX 75446-5017
HONEY GROVE TX 75446-5017
263 JIM BOWIE RD
HONEY GROVE TX 75446-3454
HONEY GROVE TX 75446-3454
409 SAM HOUSTON RD
HONEY GROVE TX 75446-3469
HONEY GROVE TX 75446-3469
Map
Hover over the map to see the ZIP code
Census data for HONEY GROVE, TX
Demographic and housing estimates in HONEY GROVE, TX
| Total population | 2,172 |
| Male | 974 |
| Female | 1,198 |
| Total population | 2,172 |
| Under 5 years | 72 |
| 5 to 9 years | 148 |
| 10 to 14 years | 229 |
| 15 to 19 years | 216 |
| 20 to 24 years | 160 |
| 25 to 34 years | 145 |
| 35 to 44 years | 364 |
| 45 to 54 years | 192 |
| 55 to 59 years | 184 |
| 60 to 64 years | 129 |
| 65 to 74 years | 175 |
| 75 to 84 years | 107 |
| 85 years and over | 51 |
| Median age (years) | 39.5 |
| Under 18 years | 575 |
| 16 years and over | 1,698 |
| 18 years and over | 1,597 |
| 21 years and over | 1,472 |
| 62 years and over | 393 |
| 65 years and over | 333 |
| Total population | 2,172 |
| One race | 2,096 |
| White | 1,838 |
| Black or African American | 234 |
| American Indian and Alaska Native | 8 |
| Asian | 16 |
| Native Hawaiian and Other Pacific Islander | 0 |
| Some other race | 0 |
| Two or more races | 76 |
| Citizen, VOTING AGE 18 and over population | 1,503 |
| Male Citizen, VOTING AGE 18 and over population | 627 |
| Female Citizen, VOTING AGE 18 and over population | 876 |
Social characteristics in HONEY GROVE, TX
| Total households | 794 |
| Family households (families) | 579 |
| Married-couple family | 367 |
| Male householder, no wife present, family | 51 |
| Female householder, no husband present, family | 161 |
| Nonfamily households | 215 |
| Average household size | 2.74 |
| Average family size | 3.33 |
Economic characteristics in HONEY GROVE, TX
| Total households | 794 |
| Less than $10,000 | 90 |
| $10,000 to $14,999 | 92 |
| $15,000 to $24,999 | 89 |
| $25,000 to $34,999 | 103 |
| $35,000 to $49,999 | 119 |
| $50,000 to $74,999 | 160 |
| $75,000 to $99,999 | 68 |
| $100,000 to $149,999 | 51 |
| $150,000 to $199,999 | 15 |
| $200,000 or more | 7 |
| Median household income (dollars) | 37,679 |
Housing characteristics in HONEY GROVE, TX
| Total housing units | 919 |
| Occupied housing units | 794 |
| Vacant housing units | 125 |
| Total housing units | 919 |
| 1-unit, detached | 776 |
| 1-unit, attached | 8 |
| 2 units | 45 |
| 3 or 4 units | 11 |
| 5 to 9 units | 15 |
| 10 to 19 units | 16 |
| 20 or more units | 14 |
| Mobile home | 34 |
| Boat, RV, van, etc. | 0 |
| Total housing units | 919 |
| Built 2014 or later | 8 |
| Built 2010 to 2013 | 11 |
| Built 2000 to 2009 | 93 |
| Built 1990 to 1999 | 47 |
| Built 1980 to 1989 | 162 |
| Built 1970 to 1979 | 91 |
| Built 1960 to 1969 | 107 |
| Built 1950 to 1959 | 135 |
| Built 1940 to 1949 | 77 |
| Built 1939 or earlier | 188 |
| Total housing units | 919 |
| 1 room | 20 |
| 2 rooms | 0 |
| 3 rooms | 30 |
| 4 rooms | 181 |
| 5 rooms | 211 |
| 6 rooms | 246 |
| 7 rooms | 112 |
| 8 rooms | 77 |
| 9 rooms or more | 42 |
| Median rooms | 5.6 |
| Total housing units | 919 |
| No bedroom | 20 |
| 1 bedroom | 79 |
| 2 bedrooms | 316 |
| 3 bedrooms | 430 |
| 4 bedrooms | 51 |
| 5 or more bedrooms | 23 |
| Occupied housing units | 794 |
| Owner-occupied | 566 |
| Renter-occupied | 228 |
| Average household size of owner-occupied unit | 2.86 |
| Average household size of renter-occupied unit | 2.43 |
| Occupied housing units | 794 |
| Moved in 2017 or later | 86 |
| Moved in 2015 to 2016 | 65 |
| Moved in 2010 to 2014 | 261 |
| Moved in 2000 to 2009 | 199 |
| Moved in 1990 to 1999 | 57 |
| Moved in 1989 and earlier | 126 |
| Owner-occupied units | 566 |
| Less than $50,000 | 193 |
| $50,000 to $99,999 | 172 |
| $100,000 to $149,999 | 117 |
| $150,000 to $199,999 | 44 |
| $200,000 to $299,999 | 27 |
| $300,000 to $499,999 | 13 |
| $500,000 to $999,999 | 0 |
| $1,000,000 or more | 0 |
| Median (dollars) | 68,500 |
| Owner-occupied units | 566 |
| Housing units with a mortgage | 193 |
| Housing units without a mortgage | 373 |
| Occupied units paying rent | 209 |
| Less than $500 | 108 |
| $500 to $999 | 53 |
| $1,000 to $1,499 | 48 |
| $1,500 to $1,999 | 0 |
| $2,000 to $2,499 | 0 |
| $2,500 to $2,999 | 0 |
| $3,000 or more | 0 |
| Median (dollars) | 448 |
| No rent paid | 19 |
Data is based on 2018 Census
ZIP Codes for other locations
State for HONEY GROVE
Texas ZIP CodesOther cities in Texas