INGLESIDE, TX ZIP Code
| City | INGLESIDE |
| State | Texas |
| ZIP Codes count | 1 (see all) |
| Post offices count | 1 (see all) |
| Total population | 10,050 (see all) |
ZIP Code in INGLESIDE, Texas
78362
This list contains only 5-digit ZIP codes. Use our zip code lookup by address feature to get the full 9-digit (ZIP+4) code.
List of INGLESIDE, TX ZIP Codes
| ZIP | TYPE | POPU |
|---|---|---|
| 78362 | STANDARD | 10,789 |
Post offices
INGLESIDE — Post Office™ 2230 STATE HIGHWAY 361 INGLESIDE, TX 78362-4139 |
Envelope example
On the bottom center of the envelope, write the address you want your letter delivered to. Include the following on separate lines:
- Recipient's full name
- Full street address
- City, State, and ZIP Code
Using the same format, write the return address in the top left corner.
Using the full ZIP+4 Code when mailing via the USPS ensures the fastest, most accurate mailing possible. If you are not sure of the full 9-digit ZIP Code, use the 5-digit ZIP Code to avoid loss of letter or package.
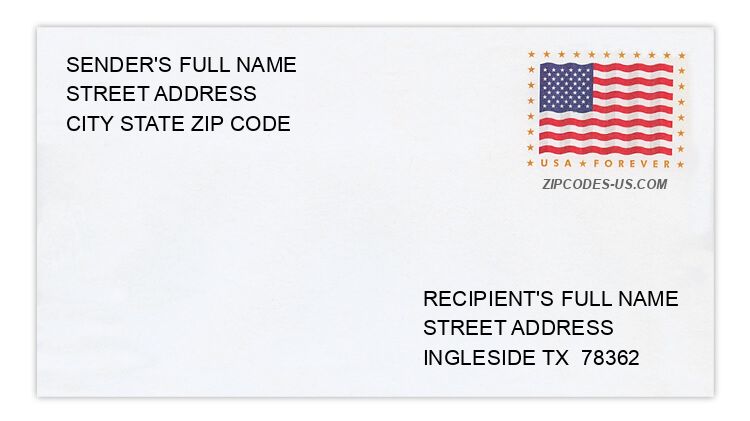
The recipient address information is provided for your reference.
Address example
2480 AVENUE E
INGLESIDE TX 78362-6012
INGLESIDE TX 78362-6012
2104 BREEZEWAY CIR
INGLESIDE TX 78362-6227
INGLESIDE TX 78362-6227
269 CORAL SEA RD
INGLESIDE TX 78362-4960
INGLESIDE TX 78362-4960
2189 GLENWOOD DR
INGLESIDE TX 78362-6208
INGLESIDE TX 78362-6208
2313 MADRID DR
INGLESIDE TX 78362-4038
INGLESIDE TX 78362-4038
2002 OAK VALE DR
INGLESIDE TX 78362-4043
INGLESIDE TX 78362-4043
Map
Hover over the map to see the ZIP code
Census data for INGLESIDE, TX
Demographic and housing estimates in INGLESIDE, TX
| Total population | 10,050 |
| Male | 5,287 |
| Female | 4,763 |
| Total population | 10,050 |
| Under 5 years | 774 |
| 5 to 9 years | 742 |
| 10 to 14 years | 865 |
| 15 to 19 years | 814 |
| 20 to 24 years | 731 |
| 25 to 34 years | 1,412 |
| 35 to 44 years | 1,349 |
| 45 to 54 years | 1,142 |
| 55 to 59 years | 520 |
| 60 to 64 years | 482 |
| 65 to 74 years | 691 |
| 75 to 84 years | 455 |
| 85 years and over | 73 |
| Median age (years) | 33.5 |
| Under 18 years | 2,823 |
| 16 years and over | 7,541 |
| 18 years and over | 7,227 |
| 21 years and over | 6,776 |
| 62 years and over | 1,541 |
| 65 years and over | 1,219 |
| Total population | 10,050 |
| One race | 9,534 |
| White | 8,729 |
| Black or African American | 403 |
| American Indian and Alaska Native | 41 |
| Asian | 173 |
| Native Hawaiian and Other Pacific Islander | 0 |
| Some other race | 188 |
| Two or more races | 516 |
| Citizen, VOTING AGE 18 and over population | 6,617 |
| Male Citizen, VOTING AGE 18 and over population | 3,553 |
| Female Citizen, VOTING AGE 18 and over population | 3,064 |
Social characteristics in INGLESIDE, TX
| Total households | 3,517 |
| Family households (families) | 2,589 |
| Married-couple family | 1,876 |
| Male householder, no wife present, family | 334 |
| Female householder, no husband present, family | 379 |
| Nonfamily households | 928 |
| Average household size | 2.83 |
| Average family size | 3.34 |
Economic characteristics in INGLESIDE, TX
| Total households | 3,517 |
| Less than $10,000 | 204 |
| $10,000 to $14,999 | 70 |
| $15,000 to $24,999 | 240 |
| $25,000 to $34,999 | 257 |
| $35,000 to $49,999 | 515 |
| $50,000 to $74,999 | 853 |
| $75,000 to $99,999 | 561 |
| $100,000 to $149,999 | 526 |
| $150,000 to $199,999 | 221 |
| $200,000 or more | 70 |
| Median household income (dollars) | 63,251 |
Housing characteristics in INGLESIDE, TX
| Total housing units | 3,899 |
| Occupied housing units | 3,517 |
| Vacant housing units | 382 |
| Total housing units | 3,899 |
| 1-unit, detached | 3,017 |
| 1-unit, attached | 26 |
| 2 units | 157 |
| 3 or 4 units | 239 |
| 5 to 9 units | 113 |
| 10 to 19 units | 130 |
| 20 or more units | 26 |
| Mobile home | 178 |
| Boat, RV, van, etc. | 13 |
| Total housing units | 3,899 |
| Built 2014 or later | 148 |
| Built 2010 to 2013 | 117 |
| Built 2000 to 2009 | 820 |
| Built 1990 to 1999 | 981 |
| Built 1980 to 1989 | 386 |
| Built 1970 to 1979 | 752 |
| Built 1960 to 1969 | 321 |
| Built 1950 to 1959 | 175 |
| Built 1940 to 1949 | 115 |
| Built 1939 or earlier | 84 |
| Total housing units | 3,899 |
| 1 room | 48 |
| 2 rooms | 84 |
| 3 rooms | 262 |
| 4 rooms | 553 |
| 5 rooms | 1,471 |
| 6 rooms | 732 |
| 7 rooms | 352 |
| 8 rooms | 294 |
| 9 rooms or more | 103 |
| Median rooms | 5.2 |
| Total housing units | 3,899 |
| No bedroom | 70 |
| 1 bedroom | 257 |
| 2 bedrooms | 821 |
| 3 bedrooms | 2,203 |
| 4 bedrooms | 494 |
| 5 or more bedrooms | 54 |
| Occupied housing units | 3,517 |
| Owner-occupied | 2,509 |
| Renter-occupied | 1,008 |
| Average household size of owner-occupied unit | 2.70 |
| Average household size of renter-occupied unit | 3.14 |
| Occupied housing units | 3,517 |
| Moved in 2017 or later | 219 |
| Moved in 2015 to 2016 | 455 |
| Moved in 2010 to 2014 | 931 |
| Moved in 2000 to 2009 | 1,065 |
| Moved in 1990 to 1999 | 473 |
| Moved in 1989 and earlier | 374 |
| Owner-occupied units | 2,509 |
| Less than $50,000 | 93 |
| $50,000 to $99,999 | 483 |
| $100,000 to $149,999 | 915 |
| $150,000 to $199,999 | 629 |
| $200,000 to $299,999 | 268 |
| $300,000 to $499,999 | 84 |
| $500,000 to $999,999 | 11 |
| $1,000,000 or more | 26 |
| Median (dollars) | 137,300 |
| Owner-occupied units | 2,509 |
| Housing units with a mortgage | 1,533 |
| Housing units without a mortgage | 976 |
| Occupied units paying rent | 980 |
| Less than $500 | 93 |
| $500 to $999 | 269 |
| $1,000 to $1,499 | 386 |
| $1,500 to $1,999 | 229 |
| $2,000 to $2,499 | 3 |
| $2,500 to $2,999 | 0 |
| $3,000 or more | 0 |
| Median (dollars) | 1,144 |
| No rent paid | 28 |
Data is based on 2018 Census
ZIP Codes for other locations
State for INGLESIDE
Texas ZIP CodesOther cities in Texas