IRVING, TX ZIP Code
| City | IRVING |
| State | Texas |
| ZIP Codes count | 12 (see all) |
| Post offices count | 4 (see all) |
| Total population | 238,637 (see all) |
ZIP Codes in IRVING, Texas
The ZIP Codes in IRVING, Texas fall within the range from 75014 to 75064. IRVING is covered by 12 ZIP Codes: 6 Standard, 2 Unique and 4 PO Box. Below is the complete list:
75014, 75015, 75016, 75017, 75038, 75039, 75059, 75060, 75061, 75062, 75063, 75064
This list contains only 5-digit ZIP codes. Use our zip code lookup by address feature to get the full 9-digit (ZIP+4) code.
List of IRVING, TX ZIP Codes
| ZIP | TYPE | POPU |
|---|---|---|
| 75014 | PO BOX | – |
| 75015 | PO BOX | – |
| 75016 | PO BOX | – |
| 75017 | PO BOX | – |
| 75038 | STANDARD | 32,128 |
| 75039 | STANDARD | 22,046 |
| 75059 | UNIQUE | – |
| 75060 | STANDARD | 49,473 |
| 75061 | STANDARD | 56,959 |
| 75062 | STANDARD | 51,846 |
| 75063 | STANDARD | 43,705 |
| 75064 | UNIQUE | – |
Post offices
CENTRAL IRVING — Post Office™ 2300 STORY RD W IRVING, TX 75038-9998 |
IRVING — Post Office™ 2701 W IRVING BLVD IRVING, TX 75061-9998 |
LAS COLINAS — Post Office™ 3900 TELEPORT BLVD IRVING, TX 75039-9998 |
VALLEY RANCH — Post Office™ 8501 N MACARTHUR BLVD IRVING, TX 75063-9998 |
Envelope example
On the bottom center of the envelope, write the address you want your letter delivered to. Include the following on separate lines:
- Recipient's full name
- Full street address
- City, State, and ZIP Code
Using the same format, write the return address in the top left corner.
Using the full ZIP+4 Code when mailing via the USPS ensures the fastest, most accurate mailing possible. If you are not sure of the full 9-digit ZIP Code, use the 5-digit ZIP Code to avoid loss of letter or package.
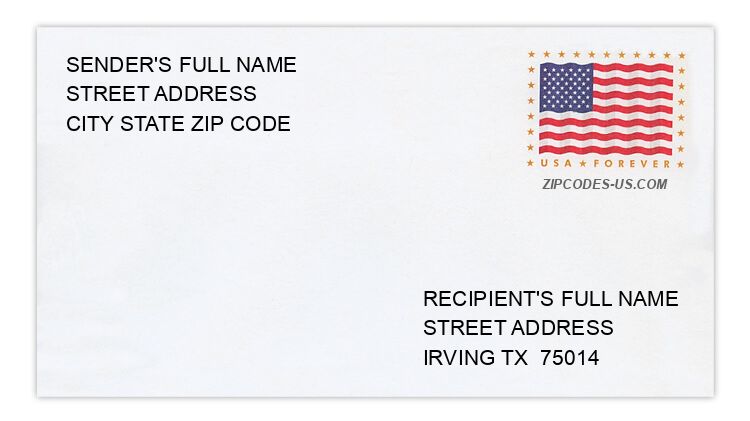
The recipient address information is provided for your reference.
Address example
109 CASA GRANDE CT
IRVING TX 75061-6907
IRVING TX 75061-6907
1910 CREEK WOOD CT
IRVING TX 75060-6746
IRVING TX 75060-6746
1282 HOLLY ST
IRVING TX 75061-5363
IRVING TX 75061-5363
4883 ISLEWORTH DR
IRVING TX 75038-4500
IRVING TX 75038-4500
746 LYNN DR W
IRVING TX 75062-5692
IRVING TX 75062-5692
226 SANTA FE TRL
IRVING TX 75063-4719
IRVING TX 75063-4719
Map
Hover over the map to see the ZIP code
Census data for IRVING, TX
Demographic and housing estimates in IRVING, TX
| Total population | 238,637 |
| Male | 118,915 |
| Female | 119,722 |
| Total population | 238,637 |
| Under 5 years | 20,475 |
| 5 to 9 years | 18,711 |
| 10 to 14 years | 16,716 |
| 15 to 19 years | 15,244 |
| 20 to 24 years | 16,223 |
| 25 to 34 years | 45,714 |
| 35 to 44 years | 37,714 |
| 45 to 54 years | 29,596 |
| 55 to 59 years | 11,927 |
| 60 to 64 years | 8,709 |
| 65 to 74 years | 10,673 |
| 75 to 84 years | 4,997 |
| 85 years and over | 1,938 |
| Median age (years) | 31.7 |
| Under 18 years | 65,225 |
| 16 years and over | 179,407 |
| 18 years and over | 173,412 |
| 21 years and over | 164,686 |
| 62 years and over | 22,650 |
| 65 years and over | 17,608 |
| Total population | 238,637 |
| One race | 231,858 |
| White | 122,339 |
| Black or African American | 31,477 |
| American Indian and Alaska Native | 1,325 |
| Asian | 44,244 |
| Native Hawaiian and Other Pacific Islander | 406 |
| Some other race | 32,067 |
| Two or more races | 6,779 |
| Citizen, VOTING AGE 18 and over population | 114,242 |
| Male Citizen, VOTING AGE 18 and over population | 54,641 |
| Female Citizen, VOTING AGE 18 and over population | 59,601 |
Social characteristics in IRVING, TX
| Total households | 84,772 |
| Family households (families) | 55,857 |
| Married-couple family | 39,008 |
| Male householder, no wife present, family | 5,330 |
| Female householder, no husband present, family | 11,519 |
| Nonfamily households | 28,915 |
| Average household size | 2.80 |
| Average family size | 3.46 |
Economic characteristics in IRVING, TX
| Total households | 84,772 |
| Less than $10,000 | 3,354 |
| $10,000 to $14,999 | 2,612 |
| $15,000 to $24,999 | 6,667 |
| $25,000 to $34,999 | 8,544 |
| $35,000 to $49,999 | 12,591 |
| $50,000 to $74,999 | 17,536 |
| $75,000 to $99,999 | 11,474 |
| $100,000 to $149,999 | 12,103 |
| $150,000 to $199,999 | 5,104 |
| $200,000 or more | 4,787 |
| Median household income (dollars) | 61,937 |
Housing characteristics in IRVING, TX
| Total housing units | 90,770 |
| Occupied housing units | 84,772 |
| Vacant housing units | 5,998 |
| Total housing units | 90,770 |
| 1-unit, detached | 34,710 |
| 1-unit, attached | 3,737 |
| 2 units | 1,576 |
| 3 or 4 units | 5,292 |
| 5 to 9 units | 10,562 |
| 10 to 19 units | 14,446 |
| 20 or more units | 19,026 |
| Mobile home | 1,289 |
| Boat, RV, van, etc. | 132 |
| Total housing units | 90,770 |
| Built 2014 or later | 2,597 |
| Built 2010 to 2013 | 3,633 |
| Built 2000 to 2009 | 10,897 |
| Built 1990 to 1999 | 16,009 |
| Built 1980 to 1989 | 21,033 |
| Built 1970 to 1979 | 13,049 |
| Built 1960 to 1969 | 12,538 |
| Built 1950 to 1959 | 8,963 |
| Built 1940 to 1949 | 1,253 |
| Built 1939 or earlier | 798 |
| Total housing units | 90,770 |
| 1 room | 1,888 |
| 2 rooms | 5,915 |
| 3 rooms | 19,454 |
| 4 rooms | 20,400 |
| 5 rooms | 15,321 |
| 6 rooms | 12,215 |
| 7 rooms | 6,837 |
| 8 rooms | 3,996 |
| 9 rooms or more | 4,744 |
| Median rooms | 4.4 |
| Total housing units | 90,770 |
| No bedroom | 2,016 |
| 1 bedroom | 26,028 |
| 2 bedrooms | 27,125 |
| 3 bedrooms | 24,236 |
| 4 bedrooms | 9,371 |
| 5 or more bedrooms | 1,994 |
| Occupied housing units | 84,772 |
| Owner-occupied | 31,492 |
| Renter-occupied | 53,280 |
| Average household size of owner-occupied unit | 3.07 |
| Average household size of renter-occupied unit | 2.64 |
| Occupied housing units | 84,772 |
| Moved in 2017 or later | 8,206 |
| Moved in 2015 to 2016 | 17,216 |
| Moved in 2010 to 2014 | 31,970 |
| Moved in 2000 to 2009 | 16,495 |
| Moved in 1990 to 1999 | 5,465 |
| Moved in 1989 and earlier | 5,420 |
| Owner-occupied units | 31,492 |
| Less than $50,000 | 1,600 |
| $50,000 to $99,999 | 3,985 |
| $100,000 to $149,999 | 8,030 |
| $150,000 to $199,999 | 5,404 |
| $200,000 to $299,999 | 4,905 |
| $300,000 to $499,999 | 5,479 |
| $500,000 to $999,999 | 1,901 |
| $1,000,000 or more | 188 |
| Median (dollars) | 165,000 |
| Owner-occupied units | 31,492 |
| Housing units with a mortgage | 20,223 |
| Housing units without a mortgage | 11,269 |
| Occupied units paying rent | 52,447 |
| Less than $500 | 696 |
| $500 to $999 | 20,601 |
| $1,000 to $1,499 | 22,340 |
| $1,500 to $1,999 | 6,597 |
| $2,000 to $2,499 | 1,603 |
| $2,500 to $2,999 | 524 |
| $3,000 or more | 86 |
| Median (dollars) | 1,086 |
| No rent paid | 833 |
Data is based on 2018 Census
ZIP Codes for other locations
State for IRVING
Texas ZIP CodesOther cities in Texas