LA PORTE, TX ZIP Code
| City | LA PORTE |
| State | Texas |
| ZIP Codes count | 2 (see all) |
| Post offices count | 1 (see all) |
| Total population | 35,386 (see all) |
ZIP Codes in LA PORTE, Texas
77571, 77572
This list contains only 5-digit ZIP codes. Use our zip code lookup by address feature to get the full 9-digit (ZIP+4) code.
List of LA PORTE, TX ZIP Codes
| ZIP | TYPE | POPU |
|---|---|---|
| 77571 | STANDARD | 37,298 |
| 77572 | PO BOX | – |
Post offices
LA PORTE — Post Office™ 801 W FAIRMONT PKWY LA PORTE, TX 77571-9998 |
Envelope example
On the bottom center of the envelope, write the address you want your letter delivered to. Include the following on separate lines:
- Recipient's full name
- Full street address
- City, State, and ZIP Code
Using the same format, write the return address in the top left corner.
Using the full ZIP+4 Code when mailing via the USPS ensures the fastest, most accurate mailing possible. If you are not sure of the full 9-digit ZIP Code, use the 5-digit ZIP Code to avoid loss of letter or package.
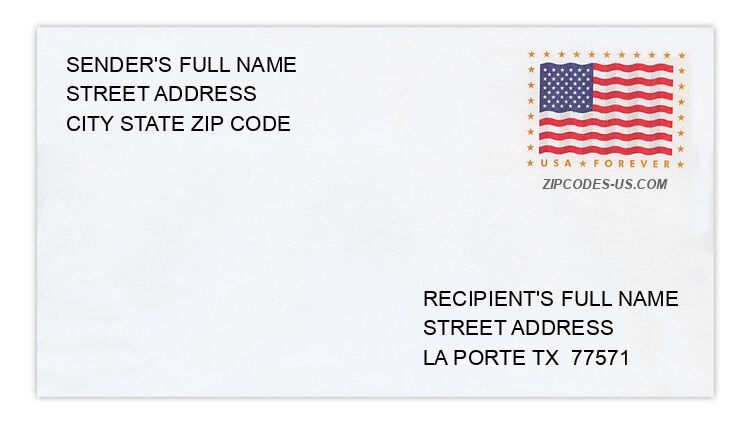
The recipient address information is provided for your reference.
Address example
238 BRIARGLEN LN
LA PORTE TX 77571-9616
LA PORTE TX 77571-9616
3817 DOLPHIN LN
LA PORTE TX 77571-7324
LA PORTE TX 77571-7324
1232 E BARBOURS CUT BLVD
LA PORTE TX 77571-3038
LA PORTE TX 77571-3038
8805 HEDGESTONE CT
LA PORTE TX 77571-3781
LA PORTE TX 77571-3781
513 N BROADWAY ST
LA PORTE TX 77571-3579
LA PORTE TX 77571-3579
11289 STRANG RD
LA PORTE TX 77571-9790
LA PORTE TX 77571-9790
Map
Hover over the map to see the ZIP code
Census data for LA PORTE, TX
Demographic and housing estimates in LA PORTE, TX
| Total population | 35,386 |
| Male | 17,484 |
| Female | 17,902 |
| Total population | 35,386 |
| Under 5 years | 2,305 |
| 5 to 9 years | 2,637 |
| 10 to 14 years | 1,971 |
| 15 to 19 years | 2,323 |
| 20 to 24 years | 2,100 |
| 25 to 34 years | 4,937 |
| 35 to 44 years | 4,725 |
| 45 to 54 years | 5,236 |
| 55 to 59 years | 2,300 |
| 60 to 64 years | 2,703 |
| 65 to 74 years | 2,521 |
| 75 to 84 years | 1,356 |
| 85 years and over | 272 |
| Median age (years) | 37.6 |
| Under 18 years | 8,337 |
| 16 years and over | 28,176 |
| 18 years and over | 27,049 |
| 21 years and over | 25,602 |
| 62 years and over | 5,800 |
| 65 years and over | 4,149 |
| Total population | 35,386 |
| One race | 33,873 |
| White | 28,990 |
| Black or African American | 1,985 |
| American Indian and Alaska Native | 218 |
| Asian | 473 |
| Native Hawaiian and Other Pacific Islander | 0 |
| Some other race | 2,207 |
| Two or more races | 1,513 |
| Citizen, VOTING AGE 18 and over population | 25,466 |
| Male Citizen, VOTING AGE 18 and over population | 12,716 |
| Female Citizen, VOTING AGE 18 and over population | 12,750 |
Social characteristics in LA PORTE, TX
| Total households | 12,563 |
| Family households (families) | 9,333 |
| Married-couple family | 7,126 |
| Male householder, no wife present, family | 636 |
| Female householder, no husband present, family | 1,571 |
| Nonfamily households | 3,230 |
| Average household size | 2.81 |
| Average family size | 3.27 |
Economic characteristics in LA PORTE, TX
| Total households | 12,563 |
| Less than $10,000 | 499 |
| $10,000 to $14,999 | 670 |
| $15,000 to $24,999 | 760 |
| $25,000 to $34,999 | 730 |
| $35,000 to $49,999 | 1,359 |
| $50,000 to $74,999 | 2,525 |
| $75,000 to $99,999 | 1,697 |
| $100,000 to $149,999 | 2,864 |
| $150,000 to $199,999 | 929 |
| $200,000 or more | 530 |
| Median household income (dollars) | 72,640 |
Housing characteristics in LA PORTE, TX
| Total housing units | 13,256 |
| Occupied housing units | 12,563 |
| Vacant housing units | 693 |
| Total housing units | 13,256 |
| 1-unit, detached | 10,334 |
| 1-unit, attached | 334 |
| 2 units | 150 |
| 3 or 4 units | 386 |
| 5 to 9 units | 333 |
| 10 to 19 units | 432 |
| 20 or more units | 655 |
| Mobile home | 601 |
| Boat, RV, van, etc. | 31 |
| Total housing units | 13,256 |
| Built 2014 or later | 187 |
| Built 2010 to 2013 | 186 |
| Built 2000 to 2009 | 2,027 |
| Built 1990 to 1999 | 2,168 |
| Built 1980 to 1989 | 2,813 |
| Built 1970 to 1979 | 2,867 |
| Built 1960 to 1969 | 1,651 |
| Built 1950 to 1959 | 712 |
| Built 1940 to 1949 | 366 |
| Built 1939 or earlier | 279 |
| Total housing units | 13,256 |
| 1 room | 177 |
| 2 rooms | 176 |
| 3 rooms | 632 |
| 4 rooms | 1,717 |
| 5 rooms | 3,465 |
| 6 rooms | 3,400 |
| 7 rooms | 1,711 |
| 8 rooms | 1,189 |
| 9 rooms or more | 789 |
| Median rooms | 5.6 |
| Total housing units | 13,256 |
| No bedroom | 183 |
| 1 bedroom | 1,048 |
| 2 bedrooms | 1,944 |
| 3 bedrooms | 7,138 |
| 4 bedrooms | 2,576 |
| 5 or more bedrooms | 367 |
| Occupied housing units | 12,563 |
| Owner-occupied | 9,317 |
| Renter-occupied | 3,246 |
| Average household size of owner-occupied unit | 2.86 |
| Average household size of renter-occupied unit | 2.67 |
| Occupied housing units | 12,563 |
| Moved in 2017 or later | 522 |
| Moved in 2015 to 2016 | 1,327 |
| Moved in 2010 to 2014 | 3,344 |
| Moved in 2000 to 2009 | 3,399 |
| Moved in 1990 to 1999 | 2,039 |
| Moved in 1989 and earlier | 1,932 |
| Owner-occupied units | 9,317 |
| Less than $50,000 | 630 |
| $50,000 to $99,999 | 1,304 |
| $100,000 to $149,999 | 3,552 |
| $150,000 to $199,999 | 2,209 |
| $200,000 to $299,999 | 1,198 |
| $300,000 to $499,999 | 318 |
| $500,000 to $999,999 | 73 |
| $1,000,000 or more | 33 |
| Median (dollars) | 138,300 |
| Owner-occupied units | 9,317 |
| Housing units with a mortgage | 5,674 |
| Housing units without a mortgage | 3,643 |
| Occupied units paying rent | 3,063 |
| Less than $500 | 310 |
| $500 to $999 | 1,188 |
| $1,000 to $1,499 | 1,242 |
| $1,500 to $1,999 | 323 |
| $2,000 to $2,499 | 0 |
| $2,500 to $2,999 | 0 |
| $3,000 or more | 0 |
| Median (dollars) | 1,009 |
| No rent paid | 183 |
Data is based on 2018 Census
ZIP Codes for other locations
State for LA PORTE
Texas ZIP CodesOther cities in Texas