LYFORD, TX ZIP Code
| City | LYFORD |
| State | Texas |
| ZIP Codes count | 1 (see all) |
| Post offices count | 2 (see all) |
| Total population | 2,581 (see all) |
ZIP Code in LYFORD, Texas
78569
This list contains only 5-digit ZIP codes. Use our zip code lookup by address feature to get the full 9-digit (ZIP+4) code.
List of LYFORD, TX ZIP Codes
| ZIP | TYPE | POPU |
|---|---|---|
| 78569 | STANDARD | 4,370 |
Post offices
LYFORD — Post Office™ 13461 W BROADWAY LYFORD, TX 78569-9998 |
RAYMONDVILLE — Post Office™ 705 E HIDALGO AVE RAYMONDVILLE, TX 78580-9998 |
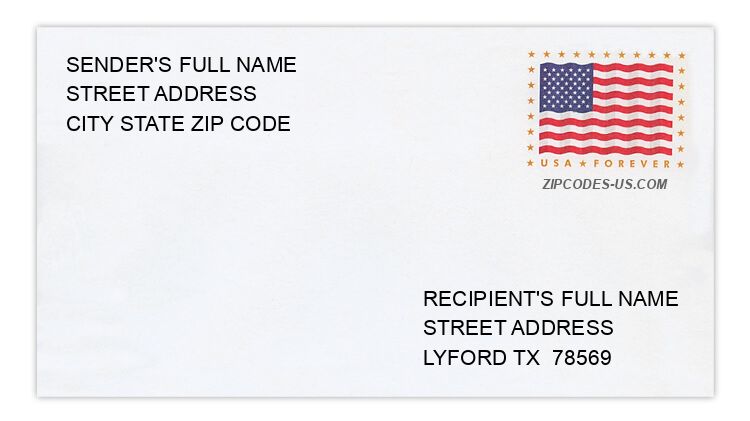
Envelope example
On the bottom center of the envelope, write the address you want your letter delivered to. Include the following on separate lines:
- Recipient's full name
- Full street address
- City, State, and ZIP Code
Using the same format, write the return address in the top left corner.
Using the full ZIP+4 Code when mailing via the USPS ensures the fastest, most accurate mailing possible. If you are not sure of the full 9-digit ZIP Code, use the 5-digit ZIP Code to avoid loss of letter or package.
The recipient address information is provided for your reference.
Address example
14111 DOVE LN
LYFORD TX 78569-2024
LYFORD TX 78569-2024
3738 EXPRESSWAY 77 S
LYFORD TX 78569-2555
LYFORD TX 78569-2555
11253 FM 2629
LYFORD TX 78569-2203
LYFORD TX 78569-2203
11807 FM 491
LYFORD TX 78569-2504
LYFORD TX 78569-2504
7431 INTERSTATE 69
LYFORD TX 78569-0047
LYFORD TX 78569-0047
9336 LILAC
LYFORD TX 78569-2405
LYFORD TX 78569-2405
Map
Hover over the map to see the ZIP code
Census data for LYFORD, TX
Demographic and housing estimates in LYFORD, TX
| Total population | 2,581 |
| Male | 1,299 |
| Female | 1,282 |
| Total population | 2,581 |
| Under 5 years | 139 |
| 5 to 9 years | 194 |
| 10 to 14 years | 246 |
| 15 to 19 years | 197 |
| 20 to 24 years | 73 |
| 25 to 34 years | 331 |
| 35 to 44 years | 309 |
| 45 to 54 years | 376 |
| 55 to 59 years | 146 |
| 60 to 64 years | 170 |
| 65 to 74 years | 170 |
| 75 to 84 years | 155 |
| 85 years and over | 75 |
| Median age (years) | 36.7 |
| Under 18 years | 688 |
| 16 years and over | 1,926 |
| 18 years and over | 1,893 |
| 21 years and over | 1,780 |
| 62 years and over | 497 |
| 65 years and over | 400 |
| Total population | 2,581 |
| One race | 2,581 |
| White | 2,578 |
| Black or African American | 0 |
| American Indian and Alaska Native | 0 |
| Asian | 0 |
| Native Hawaiian and Other Pacific Islander | 0 |
| Some other race | 3 |
| Two or more races | 0 |
| Citizen, VOTING AGE 18 and over population | 1,748 |
| Male Citizen, VOTING AGE 18 and over population | 929 |
| Female Citizen, VOTING AGE 18 and over population | 819 |
Social characteristics in LYFORD, TX
| Total households | 719 |
| Family households (families) | 613 |
| Married-couple family | 399 |
| Male householder, no wife present, family | 30 |
| Female householder, no husband present, family | 184 |
| Nonfamily households | 106 |
| Average household size | 3.59 |
| Average family size | 3.90 |
Economic characteristics in LYFORD, TX
| Total households | 719 |
| Less than $10,000 | 88 |
| $10,000 to $14,999 | 66 |
| $15,000 to $24,999 | 126 |
| $25,000 to $34,999 | 83 |
| $35,000 to $49,999 | 136 |
| $50,000 to $74,999 | 112 |
| $75,000 to $99,999 | 39 |
| $100,000 to $149,999 | 56 |
| $150,000 to $199,999 | 13 |
| $200,000 or more | 0 |
| Median household income (dollars) | 34,727 |
Housing characteristics in LYFORD, TX
| Total housing units | 819 |
| Occupied housing units | 719 |
| Vacant housing units | 100 |
| Total housing units | 819 |
| 1-unit, detached | 757 |
| 1-unit, attached | 0 |
| 2 units | 0 |
| 3 or 4 units | 0 |
| 5 to 9 units | 0 |
| 10 to 19 units | 0 |
| 20 or more units | 0 |
| Mobile home | 62 |
| Boat, RV, van, etc. | 0 |
| Total housing units | 819 |
| Built 2014 or later | 11 |
| Built 2010 to 2013 | 38 |
| Built 2000 to 2009 | 79 |
| Built 1990 to 1999 | 100 |
| Built 1980 to 1989 | 159 |
| Built 1970 to 1979 | 151 |
| Built 1960 to 1969 | 64 |
| Built 1950 to 1959 | 75 |
| Built 1940 to 1949 | 107 |
| Built 1939 or earlier | 35 |
| Total housing units | 819 |
| 1 room | 0 |
| 2 rooms | 12 |
| 3 rooms | 40 |
| 4 rooms | 159 |
| 5 rooms | 242 |
| 6 rooms | 210 |
| 7 rooms | 75 |
| 8 rooms | 70 |
| 9 rooms or more | 11 |
| Median rooms | 5.3 |
| Total housing units | 819 |
| No bedroom | 0 |
| 1 bedroom | 38 |
| 2 bedrooms | 312 |
| 3 bedrooms | 350 |
| 4 bedrooms | 116 |
| 5 or more bedrooms | 3 |
| Occupied housing units | 719 |
| Owner-occupied | 600 |
| Renter-occupied | 119 |
| Average household size of owner-occupied unit | 3.38 |
| Average household size of renter-occupied unit | 4.66 |
| Occupied housing units | 719 |
| Moved in 2017 or later | 21 |
| Moved in 2015 to 2016 | 41 |
| Moved in 2010 to 2014 | 139 |
| Moved in 2000 to 2009 | 125 |
| Moved in 1990 to 1999 | 127 |
| Moved in 1989 and earlier | 266 |
| Owner-occupied units | 600 |
| Less than $50,000 | 331 |
| $50,000 to $99,999 | 234 |
| $100,000 to $149,999 | 10 |
| $150,000 to $199,999 | 12 |
| $200,000 to $299,999 | 0 |
| $300,000 to $499,999 | 0 |
| $500,000 to $999,999 | 13 |
| $1,000,000 or more | 0 |
| Median (dollars) | 47,500 |
| Owner-occupied units | 600 |
| Housing units with a mortgage | 115 |
| Housing units without a mortgage | 485 |
| Occupied units paying rent | 114 |
| Less than $500 | 0 |
| $500 to $999 | 104 |
| $1,000 to $1,499 | 10 |
| $1,500 to $1,999 | 0 |
| $2,000 to $2,499 | 0 |
| $2,500 to $2,999 | 0 |
| $3,000 or more | 0 |
| Median (dollars) | 709 |
| No rent paid | 5 |
Data is based on 2018 Census
ZIP Codes for other locations
State for LYFORD
Texas ZIP CodesOther cities in Texas