MARBLE FALLS, TX ZIP Code
| City | MARBLE FALLS |
| State | Texas |
| ZIP Codes count | 2 (see all) |
| Post offices count | 2 (see all) |
| Total population | 6,382 (see all) |
ZIP Codes in MARBLE FALLS, Texas
78654, 78657
This list contains only 5-digit ZIP codes. Use our zip code lookup by address feature to get the full 9-digit (ZIP+4) code.
List of MARBLE FALLS, TX ZIP Codes
| ZIP | TYPE | POPU |
|---|---|---|
| 78654 | STANDARD | 18,833 |
| 78657 | STANDARD | 6,810 |
Post offices
HORSESHOE BAY — Post Office™ 9740 W FM 2147 HORSESHOE BAY, TX 78657-9998 |
MARBLE FALLS — Post Office™ 1212 N US HIGHWAY 281 MARBLE FALLS, TX 78654-9998 |
Envelope example
On the bottom center of the envelope, write the address you want your letter delivered to. Include the following on separate lines:
- Recipient's full name
- Full street address
- City, State, and ZIP Code
Using the same format, write the return address in the top left corner.
Using the full ZIP+4 Code when mailing via the USPS ensures the fastest, most accurate mailing possible. If you are not sure of the full 9-digit ZIP Code, use the 5-digit ZIP Code to avoid loss of letter or package.
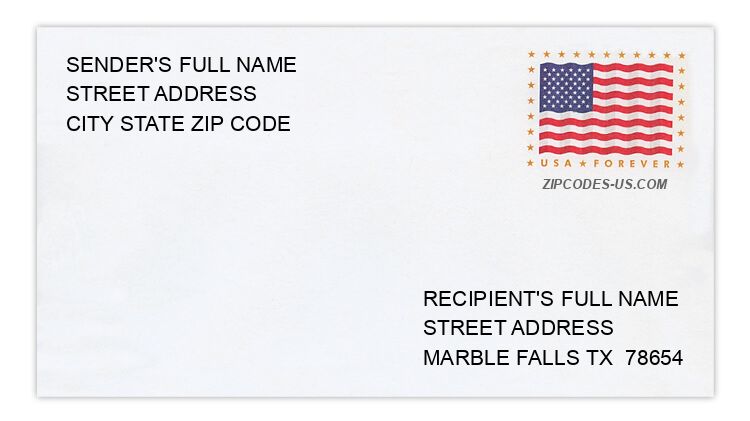
The recipient address information is provided for your reference.
Address example
512 BOSQUE TRL
MARBLE FALLS TX 78654-7410
MARBLE FALLS TX 78654-7410
1472 COACH RD
MARBLE FALLS TX 78654-3826
MARBLE FALLS TX 78654-3826
1363 MISSION HILLS DR
MARBLE FALLS TX 78654-4578
MARBLE FALLS TX 78654-4578
3030 MORGAN CIR
MARBLE FALLS TX 78654-3644
MARBLE FALLS TX 78654-3644
12320 S FM 1174
MARBLE FALLS TX 78654-3418
MARBLE FALLS TX 78654-3418
116 S OAKS RD
MARBLE FALLS TX 78654-8581
MARBLE FALLS TX 78654-8581
Map
Hover over the map to see the ZIP code
Census data for MARBLE FALLS, TX
Demographic and housing estimates in MARBLE FALLS, TX
| Total population | 6,382 |
| Male | 3,478 |
| Female | 2,904 |
| Total population | 6,382 |
| Under 5 years | 541 |
| 5 to 9 years | 197 |
| 10 to 14 years | 546 |
| 15 to 19 years | 289 |
| 20 to 24 years | 533 |
| 25 to 34 years | 696 |
| 35 to 44 years | 567 |
| 45 to 54 years | 859 |
| 55 to 59 years | 331 |
| 60 to 64 years | 465 |
| 65 to 74 years | 712 |
| 75 to 84 years | 410 |
| 85 years and over | 236 |
| Median age (years) | 39.9 |
| Under 18 years | 1,518 |
| 16 years and over | 5,005 |
| 18 years and over | 4,864 |
| 21 years and over | 4,753 |
| 62 years and over | 1,740 |
| 65 years and over | 1,358 |
| Total population | 6,382 |
| One race | 6,362 |
| White | 5,535 |
| Black or African American | 480 |
| American Indian and Alaska Native | 0 |
| Asian | 90 |
| Native Hawaiian and Other Pacific Islander | 0 |
| Some other race | 257 |
| Two or more races | 20 |
| Citizen, VOTING AGE 18 and over population | 4,425 |
| Male Citizen, VOTING AGE 18 and over population | 2,118 |
| Female Citizen, VOTING AGE 18 and over population | 2,307 |
Social characteristics in MARBLE FALLS, TX
| Total households | 2,625 |
| Family households (families) | 1,598 |
| Married-couple family | 774 |
| Male householder, no wife present, family | 444 |
| Female householder, no husband present, family | 380 |
| Nonfamily households | 1,027 |
| Average household size | 2.42 |
| Average family size | 3.24 |
Economic characteristics in MARBLE FALLS, TX
| Total households | 2,625 |
| Less than $10,000 | 134 |
| $10,000 to $14,999 | 136 |
| $15,000 to $24,999 | 479 |
| $25,000 to $34,999 | 285 |
| $35,000 to $49,999 | 474 |
| $50,000 to $74,999 | 502 |
| $75,000 to $99,999 | 468 |
| $100,000 to $149,999 | 96 |
| $150,000 to $199,999 | 16 |
| $200,000 or more | 35 |
| Median household income (dollars) | 43,390 |
Housing characteristics in MARBLE FALLS, TX
| Total housing units | 3,163 |
| Occupied housing units | 2,625 |
| Vacant housing units | 538 |
| Total housing units | 3,163 |
| 1-unit, detached | 1,537 |
| 1-unit, attached | 89 |
| 2 units | 289 |
| 3 or 4 units | 527 |
| 5 to 9 units | 79 |
| 10 to 19 units | 176 |
| 20 or more units | 169 |
| Mobile home | 297 |
| Boat, RV, van, etc. | 0 |
| Total housing units | 3,163 |
| Built 2014 or later | 58 |
| Built 2010 to 2013 | 82 |
| Built 2000 to 2009 | 977 |
| Built 1990 to 1999 | 493 |
| Built 1980 to 1989 | 461 |
| Built 1970 to 1979 | 647 |
| Built 1960 to 1969 | 269 |
| Built 1950 to 1959 | 134 |
| Built 1940 to 1949 | 19 |
| Built 1939 or earlier | 23 |
| Total housing units | 3,163 |
| 1 room | 245 |
| 2 rooms | 86 |
| 3 rooms | 204 |
| 4 rooms | 739 |
| 5 rooms | 977 |
| 6 rooms | 276 |
| 7 rooms | 306 |
| 8 rooms | 141 |
| 9 rooms or more | 189 |
| Median rooms | 4.8 |
| Total housing units | 3,163 |
| No bedroom | 245 |
| 1 bedroom | 363 |
| 2 bedrooms | 738 |
| 3 bedrooms | 1,444 |
| 4 bedrooms | 251 |
| 5 or more bedrooms | 122 |
| Occupied housing units | 2,625 |
| Owner-occupied | 1,197 |
| Renter-occupied | 1,428 |
| Average household size of owner-occupied unit | 2.54 |
| Average household size of renter-occupied unit | 2.32 |
| Occupied housing units | 2,625 |
| Moved in 2017 or later | 53 |
| Moved in 2015 to 2016 | 692 |
| Moved in 2010 to 2014 | 749 |
| Moved in 2000 to 2009 | 622 |
| Moved in 1990 to 1999 | 251 |
| Moved in 1989 and earlier | 258 |
| Owner-occupied units | 1,197 |
| Less than $50,000 | 34 |
| $50,000 to $99,999 | 168 |
| $100,000 to $149,999 | 211 |
| $150,000 to $199,999 | 307 |
| $200,000 to $299,999 | 262 |
| $300,000 to $499,999 | 182 |
| $500,000 to $999,999 | 33 |
| $1,000,000 or more | 0 |
| Median (dollars) | 185,000 |
| Owner-occupied units | 1,197 |
| Housing units with a mortgage | 574 |
| Housing units without a mortgage | 623 |
| Occupied units paying rent | 1,339 |
| Less than $500 | 216 |
| $500 to $999 | 845 |
| $1,000 to $1,499 | 268 |
| $1,500 to $1,999 | 10 |
| $2,000 to $2,499 | 0 |
| $2,500 to $2,999 | 0 |
| $3,000 or more | 0 |
| Median (dollars) | 794 |
| No rent paid | 89 |
Data is based on 2018 Census
ZIP Codes for other locations
State for MARBLE FALLS
Texas ZIP CodesOther cities in Texas