MEMPHIS, TX ZIP Code
| City | MEMPHIS |
| State | Texas |
| ZIP Codes count | 1 (see all) |
| Post offices count | 1 (see all) |
| Total population | 2,259 (see all) |
ZIP Code in MEMPHIS, Texas
79245
This list contains only 5-digit ZIP codes. Use our zip code lookup by address feature to get the full 9-digit (ZIP+4) code.
List of MEMPHIS, TX ZIP Codes
| ZIP | TYPE | POPU |
|---|---|---|
| 79245 | STANDARD | 2,304 |
Post offices
MEMPHIS — Post Office™ 700 W MAIN ST MEMPHIS, TX 79245-9998 |
Envelope example
On the bottom center of the envelope, write the address you want your letter delivered to. Include the following on separate lines:
- Recipient's full name
- Full street address
- City, State, and ZIP Code
Using the same format, write the return address in the top left corner.
Using the full ZIP+4 Code when mailing via the USPS ensures the fastest, most accurate mailing possible. If you are not sure of the full 9-digit ZIP Code, use the 5-digit ZIP Code to avoid loss of letter or package.
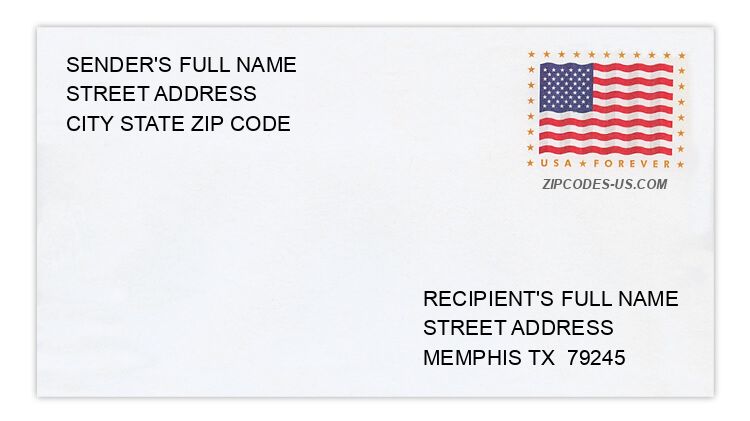
The recipient address information is provided for your reference.
Address example
1962 COUNTY ROAD 1A
MEMPHIS TX 79245-5006
MEMPHIS TX 79245-5006
1948 COUNTY ROAD 29C
MEMPHIS TX 79245-6210
MEMPHIS TX 79245-6210
132 N 6TH ST
MEMPHIS TX 79245-2860
MEMPHIS TX 79245-2860
312 S 10TH ST
MEMPHIS TX 79245-3228
MEMPHIS TX 79245-3228
507 W MAIN ST
MEMPHIS TX 79245-3301
MEMPHIS TX 79245-3301
789 W MEMPHIS ST
MEMPHIS TX 79245-3833
MEMPHIS TX 79245-3833
Map
Hover over the map to see the ZIP code
Census data for MEMPHIS, TX
Demographic and housing estimates in MEMPHIS, TX
| Total population | 2,259 |
| Male | 1,138 |
| Female | 1,121 |
| Total population | 2,259 |
| Under 5 years | 104 |
| 5 to 9 years | 111 |
| 10 to 14 years | 251 |
| 15 to 19 years | 202 |
| 20 to 24 years | 102 |
| 25 to 34 years | 179 |
| 35 to 44 years | 255 |
| 45 to 54 years | 272 |
| 55 to 59 years | 130 |
| 60 to 64 years | 199 |
| 65 to 74 years | 246 |
| 75 to 84 years | 138 |
| 85 years and over | 70 |
| Median age (years) | 40.7 |
| Under 18 years | 575 |
| 16 years and over | 1,740 |
| 18 years and over | 1,684 |
| 21 years and over | 1,582 |
| 62 years and over | 598 |
| 65 years and over | 454 |
| Total population | 2,259 |
| One race | 2,184 |
| White | 1,838 |
| Black or African American | 142 |
| American Indian and Alaska Native | 7 |
| Asian | 9 |
| Native Hawaiian and Other Pacific Islander | 0 |
| Some other race | 188 |
| Two or more races | 75 |
| Citizen, VOTING AGE 18 and over population | 1,504 |
| Male Citizen, VOTING AGE 18 and over population | 741 |
| Female Citizen, VOTING AGE 18 and over population | 763 |
Social characteristics in MEMPHIS, TX
| Total households | 922 |
| Family households (families) | 605 |
| Married-couple family | 426 |
| Male householder, no wife present, family | 23 |
| Female householder, no husband present, family | 156 |
| Nonfamily households | 317 |
| Average household size | 2.39 |
| Average family size | 3.05 |
Economic characteristics in MEMPHIS, TX
| Total households | 922 |
| Less than $10,000 | 93 |
| $10,000 to $14,999 | 121 |
| $15,000 to $24,999 | 148 |
| $25,000 to $34,999 | 183 |
| $35,000 to $49,999 | 90 |
| $50,000 to $74,999 | 118 |
| $75,000 to $99,999 | 73 |
| $100,000 to $149,999 | 77 |
| $150,000 to $199,999 | 10 |
| $200,000 or more | 9 |
| Median household income (dollars) | 32,586 |
Housing characteristics in MEMPHIS, TX
| Total housing units | 1,149 |
| Occupied housing units | 922 |
| Vacant housing units | 227 |
| Total housing units | 1,149 |
| 1-unit, detached | 1,012 |
| 1-unit, attached | 3 |
| 2 units | 29 |
| 3 or 4 units | 66 |
| 5 to 9 units | 3 |
| 10 to 19 units | 0 |
| 20 or more units | 0 |
| Mobile home | 36 |
| Boat, RV, van, etc. | 0 |
| Total housing units | 1,149 |
| Built 2014 or later | 0 |
| Built 2010 to 2013 | 0 |
| Built 2000 to 2009 | 3 |
| Built 1990 to 1999 | 38 |
| Built 1980 to 1989 | 71 |
| Built 1970 to 1979 | 178 |
| Built 1960 to 1969 | 223 |
| Built 1950 to 1959 | 179 |
| Built 1940 to 1949 | 104 |
| Built 1939 or earlier | 353 |
| Total housing units | 1,149 |
| 1 room | 15 |
| 2 rooms | 16 |
| 3 rooms | 94 |
| 4 rooms | 187 |
| 5 rooms | 306 |
| 6 rooms | 239 |
| 7 rooms | 151 |
| 8 rooms | 55 |
| 9 rooms or more | 86 |
| Median rooms | 5.4 |
| Total housing units | 1,149 |
| No bedroom | 15 |
| 1 bedroom | 102 |
| 2 bedrooms | 328 |
| 3 bedrooms | 572 |
| 4 bedrooms | 76 |
| 5 or more bedrooms | 56 |
| Occupied housing units | 922 |
| Owner-occupied | 539 |
| Renter-occupied | 383 |
| Average household size of owner-occupied unit | 2.33 |
| Average household size of renter-occupied unit | 2.46 |
| Occupied housing units | 922 |
| Moved in 2017 or later | 43 |
| Moved in 2015 to 2016 | 106 |
| Moved in 2010 to 2014 | 315 |
| Moved in 2000 to 2009 | 154 |
| Moved in 1990 to 1999 | 151 |
| Moved in 1989 and earlier | 153 |
| Owner-occupied units | 539 |
| Less than $50,000 | 273 |
| $50,000 to $99,999 | 211 |
| $100,000 to $149,999 | 25 |
| $150,000 to $199,999 | 10 |
| $200,000 to $299,999 | 15 |
| $300,000 to $499,999 | 0 |
| $500,000 to $999,999 | 5 |
| $1,000,000 or more | 0 |
| Median (dollars) | 49,100 |
| Owner-occupied units | 539 |
| Housing units with a mortgage | 82 |
| Housing units without a mortgage | 457 |
| Occupied units paying rent | 335 |
| Less than $500 | 145 |
| $500 to $999 | 161 |
| $1,000 to $1,499 | 29 |
| $1,500 to $1,999 | 0 |
| $2,000 to $2,499 | 0 |
| $2,500 to $2,999 | 0 |
| $3,000 or more | 0 |
| Median (dollars) | 530 |
| No rent paid | 48 |
Data is based on 2018 Census
ZIP Codes for other locations
State for MEMPHIS
Texas ZIP CodesOther cities in Texas