MEXIA, TX ZIP Code
| City | MEXIA |
| State | Texas |
| ZIP Codes count | 1 (see all) |
| Post offices count | 1 (see all) |
| Total population | 7,396 (see all) |
ZIP Code in MEXIA, Texas
76667
This list contains only 5-digit ZIP codes. Use our zip code lookup by address feature to get the full 9-digit (ZIP+4) code.
List of MEXIA, TX ZIP Codes
| ZIP | TYPE | POPU |
|---|---|---|
| 76667 | STANDARD | 10,385 |
Post offices
MEXIA — Post Office™ 100 N MCKINNEY ST MEXIA, TX 76667-9998 |
Envelope example
On the bottom center of the envelope, write the address you want your letter delivered to. Include the following on separate lines:
- Recipient's full name
- Full street address
- City, State, and ZIP Code
Using the same format, write the return address in the top left corner.
Using the full ZIP+4 Code when mailing via the USPS ensures the fastest, most accurate mailing possible. If you are not sure of the full 9-digit ZIP Code, use the 5-digit ZIP Code to avoid loss of letter or package.
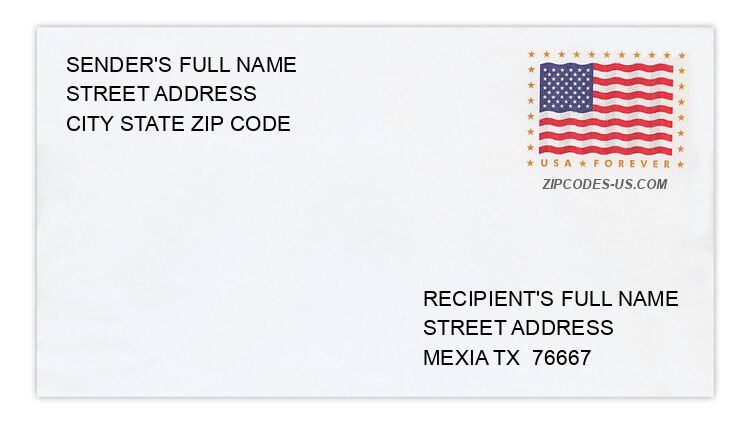
The recipient address information is provided for your reference.
Address example
565 E HOUSTON ST
MEXIA TX 76667-3736
MEXIA TX 76667-3736
927 HILLANDALE ST
MEXIA TX 76667-3814
MEXIA TX 76667-3814
305 LCR 240
MEXIA TX 76667-3371
MEXIA TX 76667-3371
132 LCR 513
MEXIA TX 76667-4889
MEXIA TX 76667-4889
5370 N HIGHWAY 14
MEXIA TX 76667-3851
MEXIA TX 76667-3851
229 W RUSK ST
MEXIA TX 76667-2168
MEXIA TX 76667-2168
Map
Hover over the map to see the ZIP code
Census data for MEXIA, TX
Demographic and housing estimates in MEXIA, TX
| Total population | 7,396 |
| Male | 3,884 |
| Female | 3,512 |
| Total population | 7,396 |
| Under 5 years | 512 |
| 5 to 9 years | 419 |
| 10 to 14 years | 507 |
| 15 to 19 years | 681 |
| 20 to 24 years | 416 |
| 25 to 34 years | 1,139 |
| 35 to 44 years | 1,044 |
| 45 to 54 years | 905 |
| 55 to 59 years | 330 |
| 60 to 64 years | 293 |
| 65 to 74 years | 640 |
| 75 to 84 years | 348 |
| 85 years and over | 162 |
| Median age (years) | 35.3 |
| Under 18 years | 1,842 |
| 16 years and over | 5,819 |
| 18 years and over | 5,554 |
| 21 years and over | 5,219 |
| 62 years and over | 1,302 |
| 65 years and over | 1,150 |
| Total population | 7,396 |
| One race | 7,236 |
| White | 4,819 |
| Black or African American | 2,055 |
| American Indian and Alaska Native | 50 |
| Asian | 64 |
| Native Hawaiian and Other Pacific Islander | 52 |
| Some other race | 196 |
| Two or more races | 160 |
| Citizen, VOTING AGE 18 and over population | 4,927 |
| Male Citizen, VOTING AGE 18 and over population | 2,461 |
| Female Citizen, VOTING AGE 18 and over population | 2,466 |
Social characteristics in MEXIA, TX
| Total households | 2,353 |
| Family households (families) | 1,560 |
| Married-couple family | 959 |
| Male householder, no wife present, family | 174 |
| Female householder, no husband present, family | 427 |
| Nonfamily households | 793 |
| Average household size | 2.94 |
| Average family size | 3.73 |
Economic characteristics in MEXIA, TX
| Total households | 2,353 |
| Less than $10,000 | 229 |
| $10,000 to $14,999 | 200 |
| $15,000 to $24,999 | 370 |
| $25,000 to $34,999 | 374 |
| $35,000 to $49,999 | 396 |
| $50,000 to $74,999 | 434 |
| $75,000 to $99,999 | 153 |
| $100,000 to $149,999 | 96 |
| $150,000 to $199,999 | 64 |
| $200,000 or more | 37 |
| Median household income (dollars) | 35,092 |
Housing characteristics in MEXIA, TX
| Total housing units | 2,764 |
| Occupied housing units | 2,353 |
| Vacant housing units | 411 |
| Total housing units | 2,764 |
| 1-unit, detached | 1,815 |
| 1-unit, attached | 61 |
| 2 units | 136 |
| 3 or 4 units | 230 |
| 5 to 9 units | 17 |
| 10 to 19 units | 72 |
| 20 or more units | 72 |
| Mobile home | 361 |
| Boat, RV, van, etc. | 0 |
| Total housing units | 2,764 |
| Built 2014 or later | 10 |
| Built 2010 to 2013 | 184 |
| Built 2000 to 2009 | 234 |
| Built 1990 to 1999 | 289 |
| Built 1980 to 1989 | 223 |
| Built 1970 to 1979 | 750 |
| Built 1960 to 1969 | 470 |
| Built 1950 to 1959 | 222 |
| Built 1940 to 1949 | 111 |
| Built 1939 or earlier | 271 |
| Total housing units | 2,764 |
| 1 room | 63 |
| 2 rooms | 11 |
| 3 rooms | 241 |
| 4 rooms | 602 |
| 5 rooms | 775 |
| 6 rooms | 536 |
| 7 rooms | 304 |
| 8 rooms | 77 |
| 9 rooms or more | 155 |
| Median rooms | 5.1 |
| Total housing units | 2,764 |
| No bedroom | 63 |
| 1 bedroom | 251 |
| 2 bedrooms | 871 |
| 3 bedrooms | 1,229 |
| 4 bedrooms | 323 |
| 5 or more bedrooms | 27 |
| Occupied housing units | 2,353 |
| Owner-occupied | 1,480 |
| Renter-occupied | 873 |
| Average household size of owner-occupied unit | 3.27 |
| Average household size of renter-occupied unit | 2.40 |
| Occupied housing units | 2,353 |
| Moved in 2017 or later | 144 |
| Moved in 2015 to 2016 | 348 |
| Moved in 2010 to 2014 | 589 |
| Moved in 2000 to 2009 | 700 |
| Moved in 1990 to 1999 | 358 |
| Moved in 1989 and earlier | 214 |
| Owner-occupied units | 1,480 |
| Less than $50,000 | 394 |
| $50,000 to $99,999 | 613 |
| $100,000 to $149,999 | 218 |
| $150,000 to $199,999 | 142 |
| $200,000 to $299,999 | 49 |
| $300,000 to $499,999 | 31 |
| $500,000 to $999,999 | 33 |
| $1,000,000 or more | 0 |
| Median (dollars) | 73,500 |
| Owner-occupied units | 1,480 |
| Housing units with a mortgage | 614 |
| Housing units without a mortgage | 866 |
| Occupied units paying rent | 837 |
| Less than $500 | 193 |
| $500 to $999 | 540 |
| $1,000 to $1,499 | 94 |
| $1,500 to $1,999 | 0 |
| $2,000 to $2,499 | 0 |
| $2,500 to $2,999 | 10 |
| $3,000 or more | 0 |
| Median (dollars) | 704 |
| No rent paid | 36 |
Data is based on 2018 Census
ZIP Codes for other locations
State for MEXIA
Texas ZIP CodesOther cities in Texas