MILFORD, TX ZIP Code
| City | MILFORD |
| State | Texas |
| ZIP Codes count | 1 (see all) |
| Post offices count | 1 (see all) |
| Total population | 732 (see all) |
ZIP Code in MILFORD, Texas
76670
This list contains only 5-digit ZIP codes. Use our zip code lookup by address feature to get the full 9-digit (ZIP+4) code.
List of MILFORD, TX ZIP Codes
| ZIP | TYPE | POPU |
|---|---|---|
| 76670 | STANDARD | 1,815 |
Post offices
MILFORD — Post Office™ 200 N MAIN MILFORD, TX 76670-9998 |
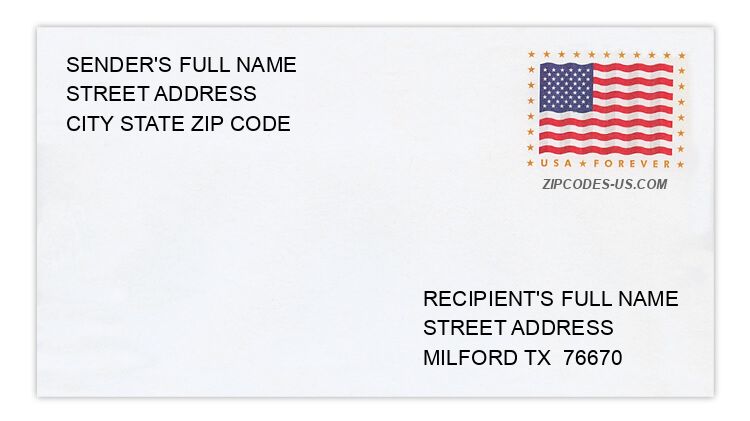
Envelope example
On the bottom center of the envelope, write the address you want your letter delivered to. Include the following on separate lines:
- Recipient's full name
- Full street address
- City, State, and ZIP Code
Using the same format, write the return address in the top left corner.
Using the full ZIP+4 Code when mailing via the USPS ensures the fastest, most accurate mailing possible. If you are not sure of the full 9-digit ZIP Code, use the 5-digit ZIP Code to avoid loss of letter or package.
The recipient address information is provided for your reference.
Address example
108 3RD ST
MILFORD TX 76670-1327
MILFORD TX 76670-1327
3885 DALE ACRES RD
MILFORD TX 76670-1026
MILFORD TX 76670-1026
284 MARBLE LN
MILFORD TX 76670-1328
MILFORD TX 76670-1328
322 S BOIS D ARC
MILFORD TX 76670-1177
MILFORD TX 76670-1177
103 S IH 35 E
MILFORD TX 76670-1143
MILFORD TX 76670-1143
336 THUNDER RD
MILFORD TX 76670-1027
MILFORD TX 76670-1027
Map
Hover over the map to see the ZIP code
Census data for MILFORD, TX
Demographic and housing estimates in MILFORD, TX
| Total population | 732 |
| Male | 382 |
| Female | 350 |
| Total population | 732 |
| Under 5 years | 15 |
| 5 to 9 years | 83 |
| 10 to 14 years | 61 |
| 15 to 19 years | 39 |
| 20 to 24 years | 55 |
| 25 to 34 years | 89 |
| 35 to 44 years | 88 |
| 45 to 54 years | 109 |
| 55 to 59 years | 47 |
| 60 to 64 years | 27 |
| 65 to 74 years | 83 |
| 75 to 84 years | 34 |
| 85 years and over | 2 |
| Median age (years) | 38.0 |
| Under 18 years | 190 |
| 16 years and over | 561 |
| 18 years and over | 542 |
| 21 years and over | 514 |
| 62 years and over | 139 |
| 65 years and over | 119 |
| Total population | 732 |
| One race | 712 |
| White | 520 |
| Black or African American | 142 |
| American Indian and Alaska Native | 9 |
| Asian | 0 |
| Native Hawaiian and Other Pacific Islander | 0 |
| Some other race | 41 |
| Two or more races | 20 |
| Citizen, VOTING AGE 18 and over population | 521 |
| Male Citizen, VOTING AGE 18 and over population | 272 |
| Female Citizen, VOTING AGE 18 and over population | 249 |
Social characteristics in MILFORD, TX
| Total households | 237 |
| Family households (families) | 171 |
| Married-couple family | 110 |
| Male householder, no wife present, family | 24 |
| Female householder, no husband present, family | 37 |
| Nonfamily households | 66 |
| Average household size | 3.09 |
| Average family size | 3.56 |
Economic characteristics in MILFORD, TX
| Total households | 237 |
| Less than $10,000 | 0 |
| $10,000 to $14,999 | 21 |
| $15,000 to $24,999 | 36 |
| $25,000 to $34,999 | 38 |
| $35,000 to $49,999 | 42 |
| $50,000 to $74,999 | 18 |
| $75,000 to $99,999 | 51 |
| $100,000 to $149,999 | 10 |
| $150,000 to $199,999 | 12 |
| $200,000 or more | 9 |
| Median household income (dollars) | 42,386 |
Housing characteristics in MILFORD, TX
| Total housing units | 279 |
| Occupied housing units | 237 |
| Vacant housing units | 42 |
| Total housing units | 279 |
| 1-unit, detached | 224 |
| 1-unit, attached | 0 |
| 2 units | 0 |
| 3 or 4 units | 0 |
| 5 to 9 units | 0 |
| 10 to 19 units | 5 |
| 20 or more units | 0 |
| Mobile home | 50 |
| Boat, RV, van, etc. | 0 |
| Total housing units | 279 |
| Built 2014 or later | 2 |
| Built 2010 to 2013 | 0 |
| Built 2000 to 2009 | 32 |
| Built 1990 to 1999 | 22 |
| Built 1980 to 1989 | 29 |
| Built 1970 to 1979 | 64 |
| Built 1960 to 1969 | 8 |
| Built 1950 to 1959 | 26 |
| Built 1940 to 1949 | 13 |
| Built 1939 or earlier | 83 |
| Total housing units | 279 |
| 1 room | 10 |
| 2 rooms | 2 |
| 3 rooms | 11 |
| 4 rooms | 77 |
| 5 rooms | 86 |
| 6 rooms | 64 |
| 7 rooms | 16 |
| 8 rooms | 6 |
| 9 rooms or more | 7 |
| Median rooms | 5.0 |
| Total housing units | 279 |
| No bedroom | 12 |
| 1 bedroom | 8 |
| 2 bedrooms | 127 |
| 3 bedrooms | 118 |
| 4 bedrooms | 14 |
| 5 or more bedrooms | 0 |
| Occupied housing units | 237 |
| Owner-occupied | 147 |
| Renter-occupied | 90 |
| Average household size of owner-occupied unit | 2.55 |
| Average household size of renter-occupied unit | 3.97 |
| Occupied housing units | 237 |
| Moved in 2017 or later | 7 |
| Moved in 2015 to 2016 | 21 |
| Moved in 2010 to 2014 | 81 |
| Moved in 2000 to 2009 | 77 |
| Moved in 1990 to 1999 | 19 |
| Moved in 1989 and earlier | 32 |
| Owner-occupied units | 147 |
| Less than $50,000 | 40 |
| $50,000 to $99,999 | 73 |
| $100,000 to $149,999 | 19 |
| $150,000 to $199,999 | 13 |
| $200,000 to $299,999 | 2 |
| $300,000 to $499,999 | 0 |
| $500,000 to $999,999 | 0 |
| $1,000,000 or more | 0 |
| Median (dollars) | 78,300 |
| Owner-occupied units | 147 |
| Housing units with a mortgage | 67 |
| Housing units without a mortgage | 80 |
| Occupied units paying rent | 82 |
| Less than $500 | 0 |
| $500 to $999 | 47 |
| $1,000 to $1,499 | 35 |
| $1,500 to $1,999 | 0 |
| $2,000 to $2,499 | 0 |
| $2,500 to $2,999 | 0 |
| $3,000 or more | 0 |
| Median (dollars) | 967 |
| No rent paid | 8 |
Data is based on 2018 Census
ZIP Codes for other locations
State for MILFORD
Texas ZIP CodesOther cities in Texas