MURPHY, TX ZIP Code
| City | MURPHY |
| State | Texas |
| ZIP Codes count | 1 (see all) |
| Post offices count | 1 (see all) |
| Total population | 20,528 (see all) |
ZIP Code in MURPHY, Texas
75094
This list contains only 5-digit ZIP codes. Use our zip code lookup by address feature to get the full 9-digit (ZIP+4) code.
List of MURPHY, TX ZIP Codes
| ZIP | TYPE | POPU |
|---|---|---|
| 75094 | STANDARD | 23,345 |
Post offices
PLANO — Post Office™ 1200 JUPITER RD PLANO, TX 75074-9998 |
Envelope example
On the bottom center of the envelope, write the address you want your letter delivered to. Include the following on separate lines:
- Recipient's full name
- Full street address
- City, State, and ZIP Code
Using the same format, write the return address in the top left corner.
Using the full ZIP+4 Code when mailing via the USPS ensures the fastest, most accurate mailing possible. If you are not sure of the full 9-digit ZIP Code, use the 5-digit ZIP Code to avoid loss of letter or package.
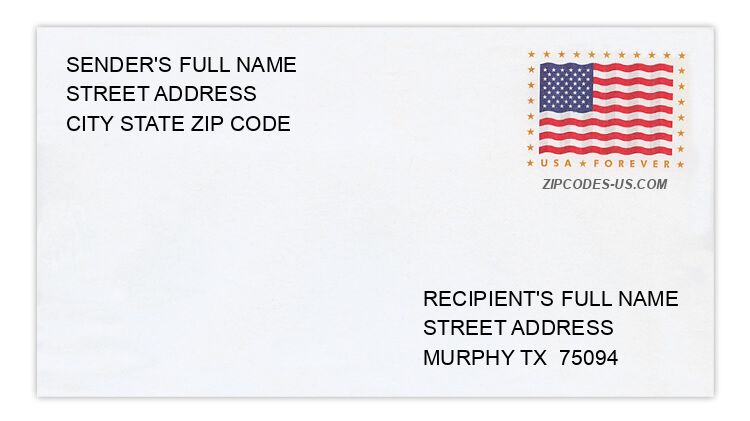
The recipient address information is provided for your reference.
Address example
616 COUNTRY MEADOW DR
MURPHY TX 75094-4280
MURPHY TX 75094-4280
620 DUNCAN DR
MURPHY TX 75094-3876
MURPHY TX 75094-3876
678 PAINT CREEK CT
MURPHY TX 75094-5302
MURPHY TX 75094-5302
1357 PRESCOTT DR
MURPHY TX 75094-4199
MURPHY TX 75094-4199
1374 THORNWOOD DR
MURPHY TX 75094-5101
MURPHY TX 75094-5101
406 WOODCREST CIR
MURPHY TX 75094-3429
MURPHY TX 75094-3429
Map
Hover over the map to see the ZIP code
Census data for MURPHY, TX
Demographic and housing estimates in MURPHY, TX
| Total population | 20,528 |
| Male | 10,207 |
| Female | 10,321 |
| Total population | 20,528 |
| Under 5 years | 1,286 |
| 5 to 9 years | 1,739 |
| 10 to 14 years | 2,221 |
| 15 to 19 years | 1,583 |
| 20 to 24 years | 890 |
| 25 to 34 years | 1,746 |
| 35 to 44 years | 3,336 |
| 45 to 54 years | 3,448 |
| 55 to 59 years | 1,096 |
| 60 to 64 years | 1,304 |
| 65 to 74 years | 1,224 |
| 75 to 84 years | 585 |
| 85 years and over | 70 |
| Median age (years) | 38.1 |
| Under 18 years | 6,382 |
| 16 years and over | 14,914 |
| 18 years and over | 14,146 |
| 21 years and over | 13,387 |
| 62 years and over | 2,574 |
| 65 years and over | 1,879 |
| Total population | 20,528 |
| One race | 19,821 |
| White | 11,334 |
| Black or African American | 2,734 |
| American Indian and Alaska Native | 180 |
| Asian | 5,452 |
| Native Hawaiian and Other Pacific Islander | 24 |
| Some other race | 97 |
| Two or more races | 707 |
| Citizen, VOTING AGE 18 and over population | 12,648 |
| Male Citizen, VOTING AGE 18 and over population | 6,457 |
| Female Citizen, VOTING AGE 18 and over population | 6,191 |
Social characteristics in MURPHY, TX
| Total households | 5,426 |
| Family households (families) | 4,930 |
| Married-couple family | 4,357 |
| Male householder, no wife present, family | 307 |
| Female householder, no husband present, family | 266 |
| Nonfamily households | 496 |
| Average household size | 3.78 |
| Average family size | 3.98 |
Economic characteristics in MURPHY, TX
| Total households | 5,426 |
| Less than $10,000 | 101 |
| $10,000 to $14,999 | 43 |
| $15,000 to $24,999 | 179 |
| $25,000 to $34,999 | 116 |
| $35,000 to $49,999 | 307 |
| $50,000 to $74,999 | 411 |
| $75,000 to $99,999 | 690 |
| $100,000 to $149,999 | 1,320 |
| $150,000 to $199,999 | 1,064 |
| $200,000 or more | 1,195 |
| Median household income (dollars) | 132,589 |
Housing characteristics in MURPHY, TX
| Total housing units | 5,488 |
| Occupied housing units | 5,426 |
| Vacant housing units | 62 |
| Total housing units | 5,488 |
| 1-unit, detached | 5,360 |
| 1-unit, attached | 33 |
| 2 units | 12 |
| 3 or 4 units | 0 |
| 5 to 9 units | 0 |
| 10 to 19 units | 0 |
| 20 or more units | 71 |
| Mobile home | 12 |
| Boat, RV, van, etc. | 0 |
| Total housing units | 5,488 |
| Built 2014 or later | 144 |
| Built 2010 to 2013 | 461 |
| Built 2000 to 2009 | 3,484 |
| Built 1990 to 1999 | 699 |
| Built 1980 to 1989 | 235 |
| Built 1970 to 1979 | 259 |
| Built 1960 to 1969 | 109 |
| Built 1950 to 1959 | 74 |
| Built 1940 to 1949 | 11 |
| Built 1939 or earlier | 12 |
| Total housing units | 5,488 |
| 1 room | 29 |
| 2 rooms | 37 |
| 3 rooms | 52 |
| 4 rooms | 29 |
| 5 rooms | 212 |
| 6 rooms | 568 |
| 7 rooms | 1,087 |
| 8 rooms | 926 |
| 9 rooms or more | 2,548 |
| Median rooms | 8.3 |
| Total housing units | 5,488 |
| No bedroom | 29 |
| 1 bedroom | 45 |
| 2 bedrooms | 132 |
| 3 bedrooms | 1,101 |
| 4 bedrooms | 2,741 |
| 5 or more bedrooms | 1,440 |
| Occupied housing units | 5,426 |
| Owner-occupied | 4,690 |
| Renter-occupied | 736 |
| Average household size of owner-occupied unit | 3.74 |
| Average household size of renter-occupied unit | 4.08 |
| Occupied housing units | 5,426 |
| Moved in 2017 or later | 72 |
| Moved in 2015 to 2016 | 583 |
| Moved in 2010 to 2014 | 1,977 |
| Moved in 2000 to 2009 | 2,400 |
| Moved in 1990 to 1999 | 224 |
| Moved in 1989 and earlier | 170 |
| Owner-occupied units | 4,690 |
| Less than $50,000 | 82 |
| $50,000 to $99,999 | 18 |
| $100,000 to $149,999 | 47 |
| $150,000 to $199,999 | 209 |
| $200,000 to $299,999 | 1,416 |
| $300,000 to $499,999 | 2,549 |
| $500,000 to $999,999 | 358 |
| $1,000,000 or more | 11 |
| Median (dollars) | 337,900 |
| Owner-occupied units | 4,690 |
| Housing units with a mortgage | 3,391 |
| Housing units without a mortgage | 1,299 |
| Occupied units paying rent | 724 |
| Less than $500 | 0 |
| $500 to $999 | 42 |
| $1,000 to $1,499 | 102 |
| $1,500 to $1,999 | 162 |
| $2,000 to $2,499 | 240 |
| $2,500 to $2,999 | 93 |
| $3,000 or more | 85 |
| Median (dollars) | 2,117 |
| No rent paid | 12 |
Data is based on 2018 Census
ZIP Codes for other locations
State for MURPHY
Texas ZIP CodesOther cities in Texas