PALMVIEW, TX ZIP Code
| City | PALMVIEW |
| State | Texas |
| ZIP Codes count | 2 (see all) |
| Post offices count | 1 (see all) |
| Total population | 5,740 (see all) |
ZIP Codes in PALMVIEW, Texas
78572, 78574
This list contains only 5-digit ZIP codes. Use our zip code lookup by address feature to get the full 9-digit (ZIP+4) code.
List of PALMVIEW, TX ZIP Codes
| ZIP | TYPE | POPU |
|---|---|---|
| 78572 | STANDARD | 76,645 |
| 78574 | STANDARD | 63,660 |
Post offices
MISSION — Post Office™ 901 N FRANCISCO AVE MISSION, TX 78572-9998 |
Envelope example
On the bottom center of the envelope, write the address you want your letter delivered to. Include the following on separate lines:
- Recipient's full name
- Full street address
- City, State, and ZIP Code
Using the same format, write the return address in the top left corner.
Using the full ZIP+4 Code when mailing via the USPS ensures the fastest, most accurate mailing possible. If you are not sure of the full 9-digit ZIP Code, use the 5-digit ZIP Code to avoid loss of letter or package.
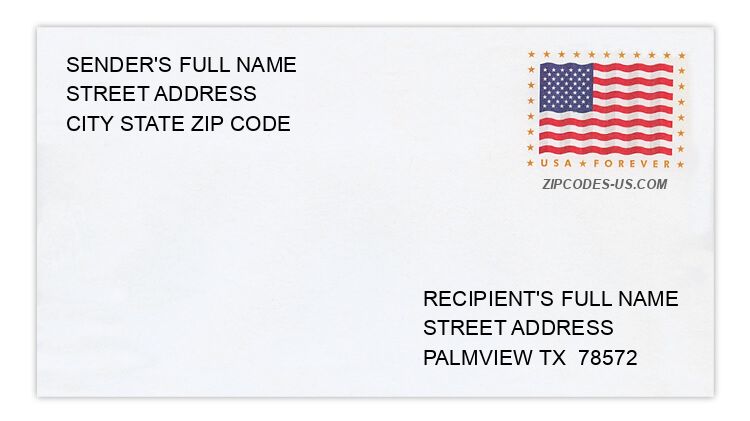
The recipient address information is provided for your reference.
Address example
2119 GREEN GATE CIR E
PALMVIEW TX 78572-5283
PALMVIEW TX 78572-5283
7328 MANZANOS ST
PALMVIEW TX 78572-1898
PALMVIEW TX 78572-1898
2266 MOCKINGBIRD ST
PALMVIEW TX 78572-5295
PALMVIEW TX 78572-5295
1824 PALM CREEK BLVD
PALMVIEW TX 78574-0329
PALMVIEW TX 78574-0329
960 RAM AVE
PALMVIEW TX 78572-8410
PALMVIEW TX 78572-8410
584 TULIPAN ST
PALMVIEW TX 78572-2283
PALMVIEW TX 78572-2283
Map
Hover over the map to see the ZIP code
Census data for PALMVIEW, TX
Demographic and housing estimates in PALMVIEW, TX
| Total population | 5,740 |
| Male | 2,863 |
| Female | 2,877 |
| Total population | 5,740 |
| Under 5 years | 399 |
| 5 to 9 years | 481 |
| 10 to 14 years | 474 |
| 15 to 19 years | 495 |
| 20 to 24 years | 370 |
| 25 to 34 years | 923 |
| 35 to 44 years | 678 |
| 45 to 54 years | 571 |
| 55 to 59 years | 236 |
| 60 to 64 years | 421 |
| 65 to 74 years | 410 |
| 75 to 84 years | 162 |
| 85 years and over | 120 |
| Median age (years) | 32.6 |
| Under 18 years | 1,623 |
| 16 years and over | 4,353 |
| 18 years and over | 4,117 |
| 21 years and over | 3,836 |
| 62 years and over | 1,023 |
| 65 years and over | 692 |
| Total population | 5,740 |
| One race | 5,740 |
| White | 5,698 |
| Black or African American | 0 |
| American Indian and Alaska Native | 0 |
| Asian | 0 |
| Native Hawaiian and Other Pacific Islander | 0 |
| Some other race | 42 |
| Two or more races | 0 |
| Citizen, VOTING AGE 18 and over population | 2,788 |
| Male Citizen, VOTING AGE 18 and over population | 1,361 |
| Female Citizen, VOTING AGE 18 and over population | 1,427 |
Social characteristics in PALMVIEW, TX
| Total households | 1,742 |
| Family households (families) | 1,416 |
| Married-couple family | 923 |
| Male householder, no wife present, family | 75 |
| Female householder, no husband present, family | 418 |
| Nonfamily households | 326 |
| Average household size | 3.30 |
| Average family size | 3.76 |
Economic characteristics in PALMVIEW, TX
| Total households | 1,742 |
| Less than $10,000 | 356 |
| $10,000 to $14,999 | 160 |
| $15,000 to $24,999 | 156 |
| $25,000 to $34,999 | 185 |
| $35,000 to $49,999 | 190 |
| $50,000 to $74,999 | 391 |
| $75,000 to $99,999 | 176 |
| $100,000 to $149,999 | 87 |
| $150,000 to $199,999 | 41 |
| $200,000 or more | 0 |
| Median household income (dollars) | 35,921 |
Housing characteristics in PALMVIEW, TX
| Total housing units | 2,058 |
| Occupied housing units | 1,742 |
| Vacant housing units | 316 |
| Total housing units | 2,058 |
| 1-unit, detached | 1,523 |
| 1-unit, attached | 0 |
| 2 units | 32 |
| 3 or 4 units | 75 |
| 5 to 9 units | 156 |
| 10 to 19 units | 29 |
| 20 or more units | 22 |
| Mobile home | 212 |
| Boat, RV, van, etc. | 9 |
| Total housing units | 2,058 |
| Built 2014 or later | 17 |
| Built 2010 to 2013 | 12 |
| Built 2000 to 2009 | 697 |
| Built 1990 to 1999 | 837 |
| Built 1980 to 1989 | 371 |
| Built 1970 to 1979 | 42 |
| Built 1960 to 1969 | 67 |
| Built 1950 to 1959 | 15 |
| Built 1940 to 1949 | 0 |
| Built 1939 or earlier | 0 |
| Total housing units | 2,058 |
| 1 room | 34 |
| 2 rooms | 112 |
| 3 rooms | 222 |
| 4 rooms | 340 |
| 5 rooms | 873 |
| 6 rooms | 326 |
| 7 rooms | 69 |
| 8 rooms | 17 |
| 9 rooms or more | 65 |
| Median rooms | 4.9 |
| Total housing units | 2,058 |
| No bedroom | 47 |
| 1 bedroom | 178 |
| 2 bedrooms | 506 |
| 3 bedrooms | 1,041 |
| 4 bedrooms | 207 |
| 5 or more bedrooms | 79 |
| Occupied housing units | 1,742 |
| Owner-occupied | 1,227 |
| Renter-occupied | 515 |
| Average household size of owner-occupied unit | 3.33 |
| Average household size of renter-occupied unit | 3.22 |
| Occupied housing units | 1,742 |
| Moved in 2017 or later | 130 |
| Moved in 2015 to 2016 | 120 |
| Moved in 2010 to 2014 | 329 |
| Moved in 2000 to 2009 | 553 |
| Moved in 1990 to 1999 | 444 |
| Moved in 1989 and earlier | 166 |
| Owner-occupied units | 1,227 |
| Less than $50,000 | 221 |
| $50,000 to $99,999 | 571 |
| $100,000 to $149,999 | 239 |
| $150,000 to $199,999 | 137 |
| $200,000 to $299,999 | 16 |
| $300,000 to $499,999 | 18 |
| $500,000 to $999,999 | 0 |
| $1,000,000 or more | 25 |
| Median (dollars) | 83,200 |
| Owner-occupied units | 1,227 |
| Housing units with a mortgage | 272 |
| Housing units without a mortgage | 955 |
| Occupied units paying rent | 486 |
| Less than $500 | 97 |
| $500 to $999 | 376 |
| $1,000 to $1,499 | 13 |
| $1,500 to $1,999 | 0 |
| $2,000 to $2,499 | 0 |
| $2,500 to $2,999 | 0 |
| $3,000 or more | 0 |
| Median (dollars) | 649 |
| No rent paid | 29 |
Data is based on 2018 Census
ZIP Codes for other locations
State for PALMVIEW
Texas ZIP CodesOther cities in Texas