PAMPA, TX ZIP Code
| City | PAMPA |
| State | Texas |
| ZIP Codes count | 2 (see all) |
| Post offices count | 1 (see all) |
| Total population | 17,793 (see all) |
ZIP Codes in PAMPA, Texas
79065, 79066
This list contains only 5-digit ZIP codes. Use our zip code lookup by address feature to get the full 9-digit (ZIP+4) code.
List of PAMPA, TX ZIP Codes
| ZIP | TYPE | POPU |
|---|---|---|
| 79065 | STANDARD | 19,538 |
| 79066 | PO BOX | – |
Post offices
PAMPA — Post Office™ 120 E FOSTER AVE PAMPA, TX 79065-9998 |
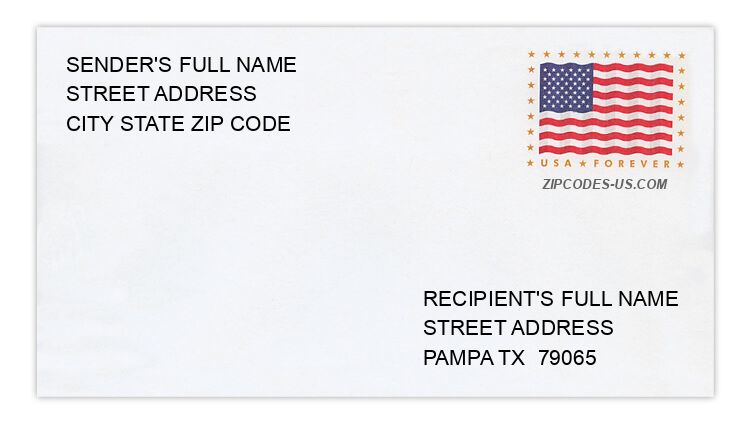
Envelope example
On the bottom center of the envelope, write the address you want your letter delivered to. Include the following on separate lines:
- Recipient's full name
- Full street address
- City, State, and ZIP Code
Using the same format, write the return address in the top left corner.
Using the full ZIP+4 Code when mailing via the USPS ensures the fastest, most accurate mailing possible. If you are not sure of the full 9-digit ZIP Code, use the 5-digit ZIP Code to avoid loss of letter or package.
The recipient address information is provided for your reference.
Address example
8801 COUNTY ROAD 10
PAMPA TX 79065-1109
PAMPA TX 79065-1109
21140 DARIANGE ST
PAMPA TX 79065-9900
PAMPA TX 79065-9900
288 ESHOM ST
PAMPA TX 79065-7842
PAMPA TX 79065-7842
8221 FM 2300
PAMPA TX 79065-6927
PAMPA TX 79065-6927
754 MAGNOLIA ST
PAMPA TX 79065-4830
PAMPA TX 79065-4830
345 S STARKWEATHER ST
PAMPA TX 79065-7457
PAMPA TX 79065-7457
Map
Hover over the map to see the ZIP code
Census data for PAMPA, TX
Demographic and housing estimates in PAMPA, TX
| Total population | 17,793 |
| Male | 8,838 |
| Female | 8,955 |
| Total population | 17,793 |
| Under 5 years | 1,428 |
| 5 to 9 years | 1,355 |
| 10 to 14 years | 1,345 |
| 15 to 19 years | 1,041 |
| 20 to 24 years | 1,249 |
| 25 to 34 years | 2,241 |
| 35 to 44 years | 2,175 |
| 45 to 54 years | 2,178 |
| 55 to 59 years | 1,149 |
| 60 to 64 years | 777 |
| 65 to 74 years | 1,411 |
| 75 to 84 years | 927 |
| 85 years and over | 517 |
| Median age (years) | 35.6 |
| Under 18 years | 4,885 |
| 16 years and over | 13,377 |
| 18 years and over | 12,908 |
| 21 years and over | 12,268 |
| 62 years and over | 3,419 |
| 65 years and over | 2,855 |
| Total population | 17,793 |
| One race | 17,340 |
| White | 15,284 |
| Black or African American | 554 |
| American Indian and Alaska Native | 251 |
| Asian | 16 |
| Native Hawaiian and Other Pacific Islander | 13 |
| Some other race | 1,222 |
| Two or more races | 453 |
| Citizen, VOTING AGE 18 and over population | 11,612 |
| Male Citizen, VOTING AGE 18 and over population | 5,730 |
| Female Citizen, VOTING AGE 18 and over population | 5,882 |
Social characteristics in PAMPA, TX
| Total households | 6,663 |
| Family households (families) | 4,228 |
| Married-couple family | 3,307 |
| Male householder, no wife present, family | 308 |
| Female householder, no husband present, family | 613 |
| Nonfamily households | 2,435 |
| Average household size | 2.64 |
| Average family size | 3.35 |
Economic characteristics in PAMPA, TX
| Total households | 6,663 |
| Less than $10,000 | 496 |
| $10,000 to $14,999 | 284 |
| $15,000 to $24,999 | 1,103 |
| $25,000 to $34,999 | 851 |
| $35,000 to $49,999 | 748 |
| $50,000 to $74,999 | 1,230 |
| $75,000 to $99,999 | 699 |
| $100,000 to $149,999 | 823 |
| $150,000 to $199,999 | 234 |
| $200,000 or more | 195 |
| Median household income (dollars) | 45,777 |
Housing characteristics in PAMPA, TX
| Total housing units | 8,342 |
| Occupied housing units | 6,663 |
| Vacant housing units | 1,679 |
| Total housing units | 8,342 |
| 1-unit, detached | 6,836 |
| 1-unit, attached | 113 |
| 2 units | 172 |
| 3 or 4 units | 167 |
| 5 to 9 units | 155 |
| 10 to 19 units | 161 |
| 20 or more units | 255 |
| Mobile home | 473 |
| Boat, RV, van, etc. | 10 |
| Total housing units | 8,342 |
| Built 2014 or later | 168 |
| Built 2010 to 2013 | 60 |
| Built 2000 to 2009 | 276 |
| Built 1990 to 1999 | 402 |
| Built 1980 to 1989 | 949 |
| Built 1970 to 1979 | 832 |
| Built 1960 to 1969 | 1,455 |
| Built 1950 to 1959 | 2,096 |
| Built 1940 to 1949 | 1,230 |
| Built 1939 or earlier | 874 |
| Total housing units | 8,342 |
| 1 room | 176 |
| 2 rooms | 249 |
| 3 rooms | 538 |
| 4 rooms | 1,501 |
| 5 rooms | 2,654 |
| 6 rooms | 1,465 |
| 7 rooms | 587 |
| 8 rooms | 455 |
| 9 rooms or more | 717 |
| Median rooms | 5.1 |
| Total housing units | 8,342 |
| No bedroom | 190 |
| 1 bedroom | 899 |
| 2 bedrooms | 2,339 |
| 3 bedrooms | 3,960 |
| 4 bedrooms | 800 |
| 5 or more bedrooms | 154 |
| Occupied housing units | 6,663 |
| Owner-occupied | 4,867 |
| Renter-occupied | 1,796 |
| Average household size of owner-occupied unit | 2.70 |
| Average household size of renter-occupied unit | 2.47 |
| Occupied housing units | 6,663 |
| Moved in 2017 or later | 398 |
| Moved in 2015 to 2016 | 825 |
| Moved in 2010 to 2014 | 1,994 |
| Moved in 2000 to 2009 | 1,532 |
| Moved in 1990 to 1999 | 792 |
| Moved in 1989 and earlier | 1,122 |
| Owner-occupied units | 4,867 |
| Less than $50,000 | 1,572 |
| $50,000 to $99,999 | 1,341 |
| $100,000 to $149,999 | 761 |
| $150,000 to $199,999 | 473 |
| $200,000 to $299,999 | 440 |
| $300,000 to $499,999 | 252 |
| $500,000 to $999,999 | 5 |
| $1,000,000 or more | 23 |
| Median (dollars) | 77,600 |
| Owner-occupied units | 4,867 |
| Housing units with a mortgage | 1,755 |
| Housing units without a mortgage | 3,112 |
| Occupied units paying rent | 1,521 |
| Less than $500 | 258 |
| $500 to $999 | 1,020 |
| $1,000 to $1,499 | 188 |
| $1,500 to $1,999 | 16 |
| $2,000 to $2,499 | 0 |
| $2,500 to $2,999 | 0 |
| $3,000 or more | 39 |
| Median (dollars) | 755 |
| No rent paid | 275 |
Data is based on 2018 Census
ZIP Codes for other locations
State for PAMPA
Texas ZIP CodesOther cities in Texas