PLANO, TX ZIP Code
| City | PLANO |
| State | Texas |
| ZIP Codes count | 9 (see all) |
| Post offices count | 5 (see all) |
| Total population | 284,579 (see all) |
ZIP Codes in PLANO, Texas
The ZIP Codes in PLANO, Texas fall within the range from 75023 to 75094. PLANO is covered by 9 ZIP Codes: 7 Standard and 2 PO Box. Below is the complete list:
75023, 75024, 75025, 75026, 75074, 75075, 75086, 75093, 75094
This list contains only 5-digit ZIP codes. Use our zip code lookup by address feature to get the full 9-digit (ZIP+4) code.
List of PLANO, TX ZIP Codes
| ZIP | TYPE | POPU |
|---|---|---|
| 75023 | STANDARD | 48,586 |
| 75024 | STANDARD | 43,331 |
| 75025 | STANDARD | 52,881 |
| 75026 | PO BOX | – |
| 75074 | STANDARD | 51,820 |
| 75075 | STANDARD | 36,221 |
| 75086 | PO BOX | – |
| 75093 | STANDARD | 46,868 |
| 75094 | STANDARD | 23,345 |
Post offices
COIT — Post Office™ 3400 COIT RD PLANO, TX 75075-9998 |
DOWNTOWN PLANO — Post Office™ 1112 18TH ST PLANO, TX 75074-9997 |
NORTHWEST PLANO — Post Office™ 3905 HEDGCOXE RD PLANO, TX 75025-9998 |
PLANO — Post Office™ 1200 JUPITER RD PLANO, TX 75074-9998 |
WILDCAT — Post Office™ 2901 W PARKER RD PLANO, TX 75023-9998 |
Envelope example
On the bottom center of the envelope, write the address you want your letter delivered to. Include the following on separate lines:
- Recipient's full name
- Full street address
- City, State, and ZIP Code
Using the same format, write the return address in the top left corner.
Using the full ZIP+4 Code when mailing via the USPS ensures the fastest, most accurate mailing possible. If you are not sure of the full 9-digit ZIP Code, use the 5-digit ZIP Code to avoid loss of letter or package.
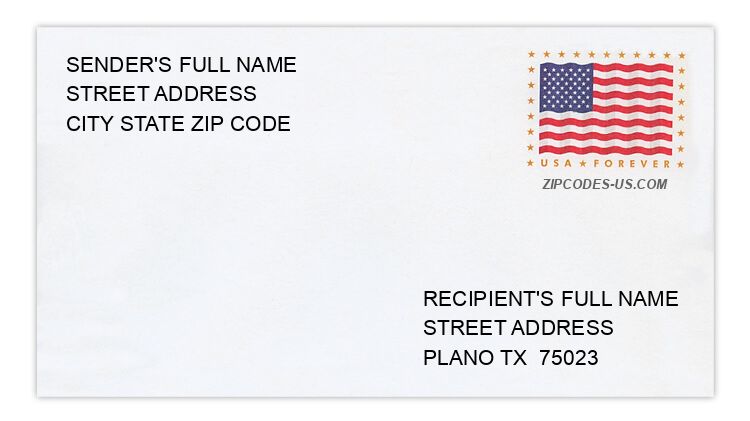
The recipient address information is provided for your reference.
Address example
2854 ELMCREST CIR
PLANO TX 75075-7507
PLANO TX 75075-7507
2984 MOUNTVIEW PL
PLANO TX 75023-3467
PLANO TX 75023-3467
4043 SALTBURN DR
PLANO TX 75093-3165
PLANO TX 75093-3165
1013 SOUTHWESTERN AVE
PLANO TX 75074-6821
PLANO TX 75074-6821
338 TALLGRASS LN
PLANO TX 75023-2379
PLANO TX 75023-2379
2729 WESTMORELAND DR
PLANO TX 75093-3114
PLANO TX 75093-3114
Map
Hover over the map to see the ZIP code
Census data for PLANO, TX
Demographic and housing estimates in PLANO, TX
| Total population | 284,579 |
| Male | 140,053 |
| Female | 144,526 |
| Total population | 284,579 |
| Under 5 years | 15,332 |
| 5 to 9 years | 17,277 |
| 10 to 14 years | 19,663 |
| 15 to 19 years | 19,184 |
| 20 to 24 years | 16,342 |
| 25 to 34 years | 39,509 |
| 35 to 44 years | 41,494 |
| 45 to 54 years | 42,775 |
| 55 to 59 years | 20,006 |
| 60 to 64 years | 16,907 |
| 65 to 74 years | 22,869 |
| 75 to 84 years | 9,665 |
| 85 years and over | 3,556 |
| Median age (years) | 38.6 |
| Under 18 years | 64,798 |
| 16 years and over | 228,278 |
| 18 years and over | 219,781 |
| 21 years and over | 210,052 |
| 62 years and over | 45,656 |
| 65 years and over | 36,090 |
| Total population | 284,579 |
| One race | 275,955 |
| White | 186,789 |
| Black or African American | 23,858 |
| American Indian and Alaska Native | 1,308 |
| Asian | 58,044 |
| Native Hawaiian and Other Pacific Islander | 279 |
| Some other race | 5,677 |
| Two or more races | 8,624 |
| Citizen, VOTING AGE 18 and over population | 183,582 |
| Male Citizen, VOTING AGE 18 and over population | 87,759 |
| Female Citizen, VOTING AGE 18 and over population | 95,823 |
Social characteristics in PLANO, TX
| Total households | 105,557 |
| Family households (families) | 74,917 |
| Married-couple family | 61,086 |
| Male householder, no wife present, family | 3,838 |
| Female householder, no husband present, family | 9,993 |
| Nonfamily households | 30,640 |
| Average household size | 2.69 |
| Average family size | 3.22 |
Economic characteristics in PLANO, TX
| Total households | 105,557 |
| Less than $10,000 | 4,190 |
| $10,000 to $14,999 | 1,899 |
| $15,000 to $24,999 | 4,647 |
| $25,000 to $34,999 | 5,721 |
| $35,000 to $49,999 | 9,274 |
| $50,000 to $74,999 | 17,269 |
| $75,000 to $99,999 | 13,539 |
| $100,000 to $149,999 | 21,286 |
| $150,000 to $199,999 | 12,657 |
| $200,000 or more | 15,075 |
| Median household income (dollars) | 92,121 |
Housing characteristics in PLANO, TX
| Total housing units | 111,066 |
| Occupied housing units | 105,557 |
| Vacant housing units | 5,509 |
| Total housing units | 111,066 |
| 1-unit, detached | 70,577 |
| 1-unit, attached | 4,185 |
| 2 units | 485 |
| 3 or 4 units | 2,691 |
| 5 to 9 units | 7,170 |
| 10 to 19 units | 10,735 |
| 20 or more units | 14,746 |
| Mobile home | 453 |
| Boat, RV, van, etc. | 24 |
| Total housing units | 111,066 |
| Built 2014 or later | 2,642 |
| Built 2010 to 2013 | 3,226 |
| Built 2000 to 2009 | 16,631 |
| Built 1990 to 1999 | 37,050 |
| Built 1980 to 1989 | 30,093 |
| Built 1970 to 1979 | 16,284 |
| Built 1960 to 1969 | 3,694 |
| Built 1950 to 1959 | 819 |
| Built 1940 to 1949 | 375 |
| Built 1939 or earlier | 252 |
| Total housing units | 111,066 |
| 1 room | 2,241 |
| 2 rooms | 3,159 |
| 3 rooms | 12,797 |
| 4 rooms | 12,721 |
| 5 rooms | 11,850 |
| 6 rooms | 13,748 |
| 7 rooms | 15,290 |
| 8 rooms | 16,005 |
| 9 rooms or more | 23,255 |
| Median rooms | 6.4 |
| Total housing units | 111,066 |
| No bedroom | 2,386 |
| 1 bedroom | 16,591 |
| 2 bedrooms | 18,779 |
| 3 bedrooms | 29,415 |
| 4 bedrooms | 35,493 |
| 5 or more bedrooms | 8,402 |
| Occupied housing units | 105,557 |
| Owner-occupied | 63,652 |
| Renter-occupied | 41,905 |
| Average household size of owner-occupied unit | 2.87 |
| Average household size of renter-occupied unit | 2.41 |
| Occupied housing units | 105,557 |
| Moved in 2017 or later | 7,092 |
| Moved in 2015 to 2016 | 15,569 |
| Moved in 2010 to 2014 | 32,353 |
| Moved in 2000 to 2009 | 28,254 |
| Moved in 1990 to 1999 | 15,250 |
| Moved in 1989 and earlier | 7,039 |
| Owner-occupied units | 63,652 |
| Less than $50,000 | 1,093 |
| $50,000 to $99,999 | 1,090 |
| $100,000 to $149,999 | 4,383 |
| $150,000 to $199,999 | 7,726 |
| $200,000 to $299,999 | 19,294 |
| $300,000 to $499,999 | 22,551 |
| $500,000 to $999,999 | 6,500 |
| $1,000,000 or more | 1,015 |
| Median (dollars) | 291,300 |
| Owner-occupied units | 63,652 |
| Housing units with a mortgage | 41,394 |
| Housing units without a mortgage | 22,258 |
| Occupied units paying rent | 41,036 |
| Less than $500 | 742 |
| $500 to $999 | 6,038 |
| $1,000 to $1,499 | 18,958 |
| $1,500 to $1,999 | 10,372 |
| $2,000 to $2,499 | 3,177 |
| $2,500 to $2,999 | 1,149 |
| $3,000 or more | 600 |
| Median (dollars) | 1,330 |
| No rent paid | 869 |
Data is based on 2018 Census
ZIP Codes for other locations
State for PLANO
Texas ZIP CodesOther cities in Texas