QUEEN CITY, TX ZIP Code
| City | QUEEN CITY |
| State | Texas |
| ZIP Codes count | 1 (see all) |
| Post offices count | 1 (see all) |
| Total population | 1,634 (see all) |
ZIP Code in QUEEN CITY, Texas
75572
This list contains only 5-digit ZIP codes. Use our zip code lookup by address feature to get the full 9-digit (ZIP+4) code.
List of QUEEN CITY, TX ZIP Codes
| ZIP | TYPE | POPU |
|---|---|---|
| 75572 | STANDARD | 3,474 |
Post offices
QUEEN CITY — Post Office™ 1014 HOUSTON ST QUEEN CITY, TX 75572-9998 |
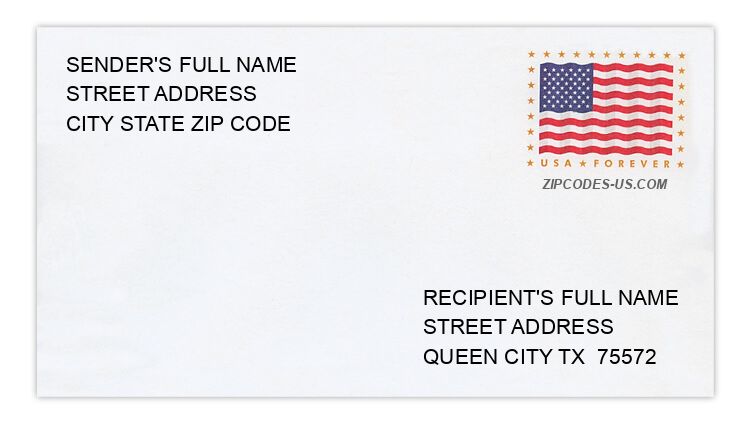
Envelope example
On the bottom center of the envelope, write the address you want your letter delivered to. Include the following on separate lines:
- Recipient's full name
- Full street address
- City, State, and ZIP Code
Using the same format, write the return address in the top left corner.
Using the full ZIP+4 Code when mailing via the USPS ensures the fastest, most accurate mailing possible. If you are not sure of the full 9-digit ZIP Code, use the 5-digit ZIP Code to avoid loss of letter or package.
The recipient address information is provided for your reference.
Address example
9 COUNTY ROAD 3537
QUEEN CITY TX 75572-3800
QUEEN CITY TX 75572-3800
562 COUNTY ROAD 3559
QUEEN CITY TX 75572-4466
QUEEN CITY TX 75572-4466
357 DORIS ST
QUEEN CITY TX 75572-2578
QUEEN CITY TX 75572-2578
589 OAK LN
QUEEN CITY TX 75572-9557
QUEEN CITY TX 75572-9557
453 PINE LN
QUEEN CITY TX 75572-2524
QUEEN CITY TX 75572-2524
498 WALKER LN
QUEEN CITY TX 75572-2391
QUEEN CITY TX 75572-2391
Map
Hover over the map to see the ZIP code
Census data for QUEEN CITY, TX
Demographic and housing estimates in QUEEN CITY, TX
| Total population | 1,634 |
| Male | 775 |
| Female | 859 |
| Total population | 1,634 |
| Under 5 years | 89 |
| 5 to 9 years | 124 |
| 10 to 14 years | 64 |
| 15 to 19 years | 216 |
| 20 to 24 years | 89 |
| 25 to 34 years | 172 |
| 35 to 44 years | 212 |
| 45 to 54 years | 153 |
| 55 to 59 years | 107 |
| 60 to 64 years | 101 |
| 65 to 74 years | 188 |
| 75 to 84 years | 91 |
| 85 years and over | 28 |
| Median age (years) | 37.4 |
| Under 18 years | 432 |
| 16 years and over | 1,293 |
| 18 years and over | 1,202 |
| 21 years and over | 1,122 |
| 62 years and over | 339 |
| 65 years and over | 307 |
| Total population | 1,634 |
| One race | 1,594 |
| White | 1,199 |
| Black or African American | 393 |
| American Indian and Alaska Native | 0 |
| Asian | 0 |
| Native Hawaiian and Other Pacific Islander | 1 |
| Some other race | 1 |
| Two or more races | 40 |
| Citizen, VOTING AGE 18 and over population | 1,202 |
| Male Citizen, VOTING AGE 18 and over population | 552 |
| Female Citizen, VOTING AGE 18 and over population | 650 |
Social characteristics in QUEEN CITY, TX
| Total households | 649 |
| Family households (families) | 435 |
| Married-couple family | 286 |
| Male householder, no wife present, family | 34 |
| Female householder, no husband present, family | 115 |
| Nonfamily households | 214 |
| Average household size | 2.51 |
| Average family size | 3.14 |
Economic characteristics in QUEEN CITY, TX
| Total households | 649 |
| Less than $10,000 | 56 |
| $10,000 to $14,999 | 38 |
| $15,000 to $24,999 | 91 |
| $25,000 to $34,999 | 87 |
| $35,000 to $49,999 | 113 |
| $50,000 to $74,999 | 128 |
| $75,000 to $99,999 | 74 |
| $100,000 to $149,999 | 36 |
| $150,000 to $199,999 | 13 |
| $200,000 or more | 13 |
| Median household income (dollars) | 43,516 |
Housing characteristics in QUEEN CITY, TX
| Total housing units | 826 |
| Occupied housing units | 649 |
| Vacant housing units | 177 |
| Total housing units | 826 |
| 1-unit, detached | 501 |
| 1-unit, attached | 14 |
| 2 units | 37 |
| 3 or 4 units | 109 |
| 5 to 9 units | 25 |
| 10 to 19 units | 23 |
| 20 or more units | 24 |
| Mobile home | 93 |
| Boat, RV, van, etc. | 0 |
| Total housing units | 826 |
| Built 2014 or later | 5 |
| Built 2010 to 2013 | 47 |
| Built 2000 to 2009 | 132 |
| Built 1990 to 1999 | 116 |
| Built 1980 to 1989 | 132 |
| Built 1970 to 1979 | 161 |
| Built 1960 to 1969 | 70 |
| Built 1950 to 1959 | 30 |
| Built 1940 to 1949 | 68 |
| Built 1939 or earlier | 65 |
| Total housing units | 826 |
| 1 room | 47 |
| 2 rooms | 3 |
| 3 rooms | 99 |
| 4 rooms | 128 |
| 5 rooms | 318 |
| 6 rooms | 125 |
| 7 rooms | 67 |
| 8 rooms | 28 |
| 9 rooms or more | 11 |
| Median rooms | 4.9 |
| Total housing units | 826 |
| No bedroom | 47 |
| 1 bedroom | 117 |
| 2 bedrooms | 270 |
| 3 bedrooms | 346 |
| 4 bedrooms | 38 |
| 5 or more bedrooms | 8 |
| Occupied housing units | 649 |
| Owner-occupied | 363 |
| Renter-occupied | 286 |
| Average household size of owner-occupied unit | 2.69 |
| Average household size of renter-occupied unit | 2.28 |
| Occupied housing units | 649 |
| Moved in 2017 or later | 8 |
| Moved in 2015 to 2016 | 102 |
| Moved in 2010 to 2014 | 224 |
| Moved in 2000 to 2009 | 146 |
| Moved in 1990 to 1999 | 83 |
| Moved in 1989 and earlier | 86 |
| Owner-occupied units | 363 |
| Less than $50,000 | 98 |
| $50,000 to $99,999 | 136 |
| $100,000 to $149,999 | 96 |
| $150,000 to $199,999 | 23 |
| $200,000 to $299,999 | 7 |
| $300,000 to $499,999 | 0 |
| $500,000 to $999,999 | 3 |
| $1,000,000 or more | 0 |
| Median (dollars) | 82,100 |
| Owner-occupied units | 363 |
| Housing units with a mortgage | 166 |
| Housing units without a mortgage | 197 |
| Occupied units paying rent | 271 |
| Less than $500 | 64 |
| $500 to $999 | 187 |
| $1,000 to $1,499 | 20 |
| $1,500 to $1,999 | 0 |
| $2,000 to $2,499 | 0 |
| $2,500 to $2,999 | 0 |
| $3,000 or more | 0 |
| Median (dollars) | 589 |
| No rent paid | 15 |
Data is based on 2018 Census
ZIP Codes for other locations
State for QUEEN CITY
Texas ZIP CodesOther cities in Texas