SALADO, TX ZIP Code
| City | SALADO |
| State | Texas |
| ZIP Codes count | 1 (see all) |
| Post offices count | 1 (see all) |
| Total population | 2,897 (see all) |
ZIP Code in SALADO, Texas
76571
This list contains only 5-digit ZIP codes. Use our zip code lookup by address feature to get the full 9-digit (ZIP+4) code.
List of SALADO, TX ZIP Codes
| ZIP | TYPE | POPU |
|---|---|---|
| 76571 | STANDARD | 9,384 |
Post offices
SALADO — Post Office™ 820 N MAIN ST SALADO, TX 76571-9998 |
Envelope example
On the bottom center of the envelope, write the address you want your letter delivered to. Include the following on separate lines:
- Recipient's full name
- Full street address
- City, State, and ZIP Code
Using the same format, write the return address in the top left corner.
Using the full ZIP+4 Code when mailing via the USPS ensures the fastest, most accurate mailing possible. If you are not sure of the full 9-digit ZIP Code, use the 5-digit ZIP Code to avoid loss of letter or package.
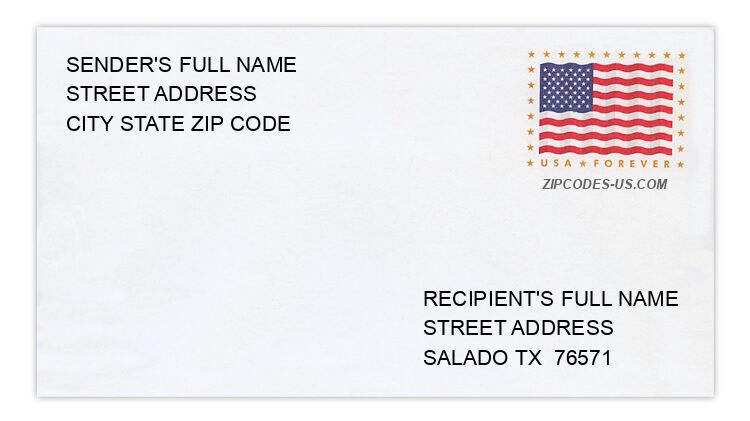
The recipient address information is provided for your reference.
Address example
17 LANE LOOP
SALADO TX 76571-5988
SALADO TX 76571-5988
765 QUAIL RIDGE RD
SALADO TX 76571-9309
SALADO TX 76571-9309
243 S CHURCH ST
SALADO TX 76571-5687
SALADO TX 76571-5687
271 SALADO PLAZA DR
SALADO TX 76571-5615
SALADO TX 76571-5615
1142 SHEPHERD DR
SALADO TX 76571-6341
SALADO TX 76571-6341
183 TOMMY LOOP
SALADO TX 76571-5267
SALADO TX 76571-5267
Map
Hover over the map to see the ZIP code
Census data for SALADO, TX
Demographic and housing estimates in SALADO, TX
| Total population | 2,897 |
| Male | 1,477 |
| Female | 1,420 |
| Total population | 2,897 |
| Under 5 years | 293 |
| 5 to 9 years | 196 |
| 10 to 14 years | 178 |
| 15 to 19 years | 205 |
| 20 to 24 years | 85 |
| 25 to 34 years | 234 |
| 35 to 44 years | 357 |
| 45 to 54 years | 236 |
| 55 to 59 years | 177 |
| 60 to 64 years | 171 |
| 65 to 74 years | 454 |
| 75 to 84 years | 245 |
| 85 years and over | 66 |
| Median age (years) | 41.5 |
| Under 18 years | 768 |
| 16 years and over | 2,200 |
| 18 years and over | 2,129 |
| 21 years and over | 2,008 |
| 62 years and over | 886 |
| 65 years and over | 765 |
| Total population | 2,897 |
| One race | 2,872 |
| White | 2,688 |
| Black or African American | 62 |
| American Indian and Alaska Native | 0 |
| Asian | 21 |
| Native Hawaiian and Other Pacific Islander | 0 |
| Some other race | 101 |
| Two or more races | 25 |
| Citizen, VOTING AGE 18 and over population | 1,985 |
| Male Citizen, VOTING AGE 18 and over population | 994 |
| Female Citizen, VOTING AGE 18 and over population | 991 |
Social characteristics in SALADO, TX
| Total households | 1,029 |
| Family households (families) | 806 |
| Married-couple family | 666 |
| Male householder, no wife present, family | 54 |
| Female householder, no husband present, family | 86 |
| Nonfamily households | 223 |
| Average household size | 2.82 |
| Average family size | 3.24 |
Economic characteristics in SALADO, TX
| Total households | 1,029 |
| Less than $10,000 | 19 |
| $10,000 to $14,999 | 28 |
| $15,000 to $24,999 | 63 |
| $25,000 to $34,999 | 52 |
| $35,000 to $49,999 | 115 |
| $50,000 to $74,999 | 198 |
| $75,000 to $99,999 | 192 |
| $100,000 to $149,999 | 164 |
| $150,000 to $199,999 | 95 |
| $200,000 or more | 103 |
| Median household income (dollars) | 77,297 |
Housing characteristics in SALADO, TX
| Total housing units | 1,113 |
| Occupied housing units | 1,029 |
| Vacant housing units | 84 |
| Total housing units | 1,113 |
| 1-unit, detached | 981 |
| 1-unit, attached | 34 |
| 2 units | 26 |
| 3 or 4 units | 0 |
| 5 to 9 units | 24 |
| 10 to 19 units | 22 |
| 20 or more units | 0 |
| Mobile home | 26 |
| Boat, RV, van, etc. | 0 |
| Total housing units | 1,113 |
| Built 2014 or later | 0 |
| Built 2010 to 2013 | 0 |
| Built 2000 to 2009 | 232 |
| Built 1990 to 1999 | 388 |
| Built 1980 to 1989 | 320 |
| Built 1970 to 1979 | 103 |
| Built 1960 to 1969 | 5 |
| Built 1950 to 1959 | 29 |
| Built 1940 to 1949 | 19 |
| Built 1939 or earlier | 17 |
| Total housing units | 1,113 |
| 1 room | 0 |
| 2 rooms | 0 |
| 3 rooms | 83 |
| 4 rooms | 113 |
| 5 rooms | 234 |
| 6 rooms | 203 |
| 7 rooms | 161 |
| 8 rooms | 112 |
| 9 rooms or more | 207 |
| Median rooms | 6.1 |
| Total housing units | 1,113 |
| No bedroom | 0 |
| 1 bedroom | 62 |
| 2 bedrooms | 182 |
| 3 bedrooms | 651 |
| 4 bedrooms | 198 |
| 5 or more bedrooms | 20 |
| Occupied housing units | 1,029 |
| Owner-occupied | 796 |
| Renter-occupied | 233 |
| Average household size of owner-occupied unit | 2.64 |
| Average household size of renter-occupied unit | 3.43 |
| Occupied housing units | 1,029 |
| Moved in 2017 or later | 76 |
| Moved in 2015 to 2016 | 67 |
| Moved in 2010 to 2014 | 282 |
| Moved in 2000 to 2009 | 283 |
| Moved in 1990 to 1999 | 262 |
| Moved in 1989 and earlier | 59 |
| Owner-occupied units | 796 |
| Less than $50,000 | 8 |
| $50,000 to $99,999 | 37 |
| $100,000 to $149,999 | 91 |
| $150,000 to $199,999 | 119 |
| $200,000 to $299,999 | 221 |
| $300,000 to $499,999 | 281 |
| $500,000 to $999,999 | 29 |
| $1,000,000 or more | 10 |
| Median (dollars) | 264,500 |
| Owner-occupied units | 796 |
| Housing units with a mortgage | 516 |
| Housing units without a mortgage | 280 |
| Occupied units paying rent | 169 |
| Less than $500 | 13 |
| $500 to $999 | 65 |
| $1,000 to $1,499 | 77 |
| $1,500 to $1,999 | 14 |
| $2,000 to $2,499 | 0 |
| $2,500 to $2,999 | 0 |
| $3,000 or more | 0 |
| Median (dollars) | 1,030 |
| No rent paid | 64 |
Data is based on 2018 Census
ZIP Codes for other locations
State for SALADO
Texas ZIP CodesOther cities in Texas