SAN SABA, TX ZIP Code
| City | SAN SABA |
| State | Texas |
| ZIP Codes count | 1 (see all) |
| Post offices count | 1 (see all) |
| Total population | 3,116 (see all) |
ZIP Code in SAN SABA, Texas
76877
This list contains only 5-digit ZIP codes. Use our zip code lookup by address feature to get the full 9-digit (ZIP+4) code.
List of SAN SABA, TX ZIP Codes
| ZIP | TYPE | POPU |
|---|---|---|
| 76877 | STANDARD | 4,303 |
Post offices
SAN SABA — Post Office™ 603 S HIGH ST SAN SABA, TX 76877-9998 |
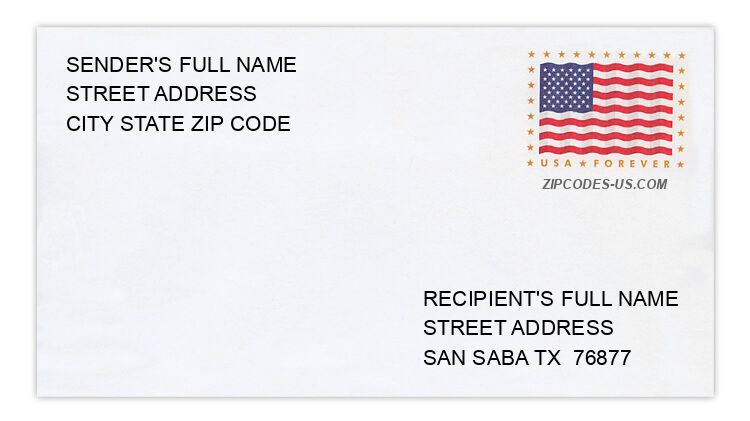
Envelope example
On the bottom center of the envelope, write the address you want your letter delivered to. Include the following on separate lines:
- Recipient's full name
- Full street address
- City, State, and ZIP Code
Using the same format, write the return address in the top left corner.
Using the full ZIP+4 Code when mailing via the USPS ensures the fastest, most accurate mailing possible. If you are not sure of the full 9-digit ZIP Code, use the 5-digit ZIP Code to avoid loss of letter or package.
The recipient address information is provided for your reference.
Address example
1634 COUNTY ROAD 315
SAN SABA TX 76877-7231
SAN SABA TX 76877-7231
191 COUNTY ROAD 438
SAN SABA TX 76877-8849
SAN SABA TX 76877-8849
643 E STOREY ST
SAN SABA TX 76877-4717
SAN SABA TX 76877-4717
872 PRIVATE ROAD 430C
SAN SABA TX 76877-1507
SAN SABA TX 76877-1507
522 S 9TH ST
SAN SABA TX 76877-5628
SAN SABA TX 76877-5628
204 S FENTRESS ST
SAN SABA TX 76877-5410
SAN SABA TX 76877-5410
Map
Hover over the map to see the ZIP code
Census data for SAN SABA, TX
Demographic and housing estimates in SAN SABA, TX
| Total population | 3,116 |
| Male | 1,348 |
| Female | 1,768 |
| Total population | 3,116 |
| Under 5 years | 215 |
| 5 to 9 years | 180 |
| 10 to 14 years | 285 |
| 15 to 19 years | 180 |
| 20 to 24 years | 276 |
| 25 to 34 years | 602 |
| 35 to 44 years | 394 |
| 45 to 54 years | 258 |
| 55 to 59 years | 129 |
| 60 to 64 years | 175 |
| 65 to 74 years | 222 |
| 75 to 84 years | 145 |
| 85 years and over | 55 |
| Median age (years) | 30.6 |
| Under 18 years | 799 |
| 16 years and over | 2,428 |
| 18 years and over | 2,317 |
| 21 years and over | 2,234 |
| 62 years and over | 515 |
| 65 years and over | 422 |
| Total population | 3,116 |
| One race | 2,946 |
| White | 2,405 |
| Black or African American | 135 |
| American Indian and Alaska Native | 0 |
| Asian | 3 |
| Native Hawaiian and Other Pacific Islander | 0 |
| Some other race | 403 |
| Two or more races | 170 |
| Citizen, VOTING AGE 18 and over population | 1,924 |
| Male Citizen, VOTING AGE 18 and over population | 729 |
| Female Citizen, VOTING AGE 18 and over population | 1,195 |
Social characteristics in SAN SABA, TX
| Total households | 921 |
| Family households (families) | 585 |
| Married-couple family | 390 |
| Male householder, no wife present, family | 113 |
| Female householder, no husband present, family | 82 |
| Nonfamily households | 336 |
| Average household size | 2.69 |
| Average family size | 3.39 |
Economic characteristics in SAN SABA, TX
| Total households | 921 |
| Less than $10,000 | 101 |
| $10,000 to $14,999 | 44 |
| $15,000 to $24,999 | 210 |
| $25,000 to $34,999 | 108 |
| $35,000 to $49,999 | 150 |
| $50,000 to $74,999 | 187 |
| $75,000 to $99,999 | 69 |
| $100,000 to $149,999 | 37 |
| $150,000 to $199,999 | 12 |
| $200,000 or more | 3 |
| Median household income (dollars) | 34,583 |
Housing characteristics in SAN SABA, TX
| Total housing units | 1,149 |
| Occupied housing units | 921 |
| Vacant housing units | 228 |
| Total housing units | 1,149 |
| 1-unit, detached | 860 |
| 1-unit, attached | 16 |
| 2 units | 100 |
| 3 or 4 units | 0 |
| 5 to 9 units | 26 |
| 10 to 19 units | 0 |
| 20 or more units | 0 |
| Mobile home | 147 |
| Boat, RV, van, etc. | 0 |
| Total housing units | 1,149 |
| Built 2014 or later | 0 |
| Built 2010 to 2013 | 9 |
| Built 2000 to 2009 | 67 |
| Built 1990 to 1999 | 91 |
| Built 1980 to 1989 | 173 |
| Built 1970 to 1979 | 143 |
| Built 1960 to 1969 | 242 |
| Built 1950 to 1959 | 145 |
| Built 1940 to 1949 | 75 |
| Built 1939 or earlier | 204 |
| Total housing units | 1,149 |
| 1 room | 11 |
| 2 rooms | 21 |
| 3 rooms | 174 |
| 4 rooms | 257 |
| 5 rooms | 311 |
| 6 rooms | 264 |
| 7 rooms | 77 |
| 8 rooms | 17 |
| 9 rooms or more | 17 |
| Median rooms | 4.9 |
| Total housing units | 1,149 |
| No bedroom | 11 |
| 1 bedroom | 98 |
| 2 bedrooms | 459 |
| 3 bedrooms | 526 |
| 4 bedrooms | 55 |
| 5 or more bedrooms | 0 |
| Occupied housing units | 921 |
| Owner-occupied | 533 |
| Renter-occupied | 388 |
| Average household size of owner-occupied unit | 2.40 |
| Average household size of renter-occupied unit | 3.10 |
| Occupied housing units | 921 |
| Moved in 2017 or later | 11 |
| Moved in 2015 to 2016 | 72 |
| Moved in 2010 to 2014 | 349 |
| Moved in 2000 to 2009 | 270 |
| Moved in 1990 to 1999 | 99 |
| Moved in 1989 and earlier | 120 |
| Owner-occupied units | 533 |
| Less than $50,000 | 122 |
| $50,000 to $99,999 | 243 |
| $100,000 to $149,999 | 100 |
| $150,000 to $199,999 | 35 |
| $200,000 to $299,999 | 21 |
| $300,000 to $499,999 | 8 |
| $500,000 to $999,999 | 4 |
| $1,000,000 or more | 0 |
| Median (dollars) | 84,100 |
| Owner-occupied units | 533 |
| Housing units with a mortgage | 253 |
| Housing units without a mortgage | 280 |
| Occupied units paying rent | 265 |
| Less than $500 | 38 |
| $500 to $999 | 196 |
| $1,000 to $1,499 | 28 |
| $1,500 to $1,999 | 0 |
| $2,000 to $2,499 | 0 |
| $2,500 to $2,999 | 0 |
| $3,000 or more | 3 |
| Median (dollars) | 709 |
| No rent paid | 123 |
Data is based on 2018 Census
ZIP Codes for other locations
State for SAN SABA
Texas ZIP CodesOther cities in Texas