SELMA, TX ZIP Code
| City | SELMA |
| State | Texas |
| ZIP Codes count | 1 (see all) |
| Post offices count | 1 (see all) |
| Total population | 9,895 (see all) |
ZIP Code in SELMA, Texas
78154
This list contains only 5-digit ZIP codes. Use our zip code lookup by address feature to get the full 9-digit (ZIP+4) code.
List of SELMA, TX ZIP Codes
| ZIP | TYPE | POPU |
|---|---|---|
| 78154 | STANDARD | 39,718 |
Post offices
SCHERTZ — Post Office™ 1081 ELBEL RD SCHERTZ, TX 78154-9998 |
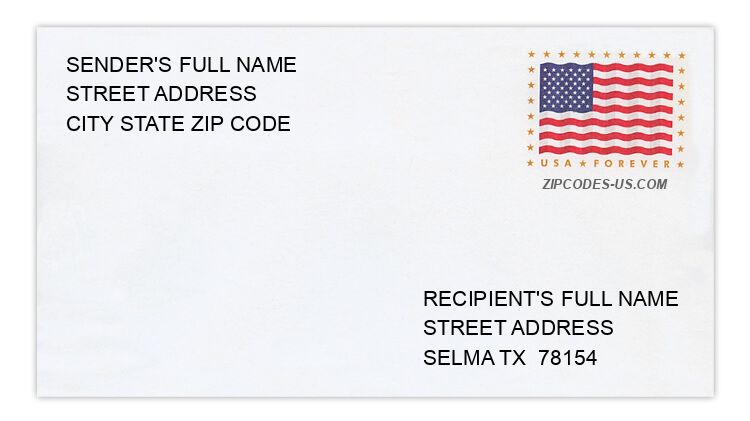
Envelope example
On the bottom center of the envelope, write the address you want your letter delivered to. Include the following on separate lines:
- Recipient's full name
- Full street address
- City, State, and ZIP Code
Using the same format, write the return address in the top left corner.
Using the full ZIP+4 Code when mailing via the USPS ensures the fastest, most accurate mailing possible. If you are not sure of the full 9-digit ZIP Code, use the 5-digit ZIP Code to avoid loss of letter or package.
The recipient address information is provided for your reference.
Address example
16369 CHELSEA PL
SELMA TX 78154-1880
SELMA TX 78154-1880
15800 CHIPPEWA BLVD
SELMA TX 78154-3310
SELMA TX 78154-3310
7940 DEERFIELD BLVD
SELMA TX 78154-3370
SELMA TX 78154-3370
16109 IKE LN
SELMA TX 78154-1154
SELMA TX 78154-1154
8937 INTERLACHEN
SELMA TX 78154-1329
SELMA TX 78154-1329
16565 RETAMA CROWN
SELMA TX 78154-3884
SELMA TX 78154-3884
Map
Hover over the map to see the ZIP code
Census data for SELMA, TX
Demographic and housing estimates in SELMA, TX
| Total population | 9,895 |
| Male | 4,866 |
| Female | 5,029 |
| Total population | 9,895 |
| Under 5 years | 884 |
| 5 to 9 years | 981 |
| 10 to 14 years | 836 |
| 15 to 19 years | 571 |
| 20 to 24 years | 474 |
| 25 to 34 years | 2,050 |
| 35 to 44 years | 1,580 |
| 45 to 54 years | 1,024 |
| 55 to 59 years | 551 |
| 60 to 64 years | 385 |
| 65 to 74 years | 375 |
| 75 to 84 years | 153 |
| 85 years and over | 31 |
| Median age (years) | 31.6 |
| Under 18 years | 3,080 |
| 16 years and over | 7,062 |
| 18 years and over | 6,815 |
| 21 years and over | 6,593 |
| 62 years and over | 828 |
| 65 years and over | 559 |
| Total population | 9,895 |
| One race | 8,717 |
| White | 6,002 |
| Black or African American | 1,019 |
| American Indian and Alaska Native | 0 |
| Asian | 600 |
| Native Hawaiian and Other Pacific Islander | 12 |
| Some other race | 1,084 |
| Two or more races | 1,178 |
| Citizen, VOTING AGE 18 and over population | 6,459 |
| Male Citizen, VOTING AGE 18 and over population | 3,089 |
| Female Citizen, VOTING AGE 18 and over population | 3,370 |
Social characteristics in SELMA, TX
| Total households | 3,353 |
| Family households (families) | 2,314 |
| Married-couple family | 1,781 |
| Male householder, no wife present, family | 60 |
| Female householder, no husband present, family | 473 |
| Nonfamily households | 1,039 |
| Average household size | 2.94 |
| Average family size | 3.57 |
Economic characteristics in SELMA, TX
| Total households | 3,353 |
| Less than $10,000 | 106 |
| $10,000 to $14,999 | 44 |
| $15,000 to $24,999 | 172 |
| $25,000 to $34,999 | 240 |
| $35,000 to $49,999 | 264 |
| $50,000 to $74,999 | 887 |
| $75,000 to $99,999 | 345 |
| $100,000 to $149,999 | 869 |
| $150,000 to $199,999 | 295 |
| $200,000 or more | 131 |
| Median household income (dollars) | 74,293 |
Housing characteristics in SELMA, TX
| Total housing units | 3,452 |
| Occupied housing units | 3,353 |
| Vacant housing units | 99 |
| Total housing units | 3,452 |
| 1-unit, detached | 2,605 |
| 1-unit, attached | 16 |
| 2 units | 0 |
| 3 or 4 units | 158 |
| 5 to 9 units | 117 |
| 10 to 19 units | 162 |
| 20 or more units | 394 |
| Mobile home | 0 |
| Boat, RV, van, etc. | 0 |
| Total housing units | 3,452 |
| Built 2014 or later | 251 |
| Built 2010 to 2013 | 692 |
| Built 2000 to 2009 | 1,811 |
| Built 1990 to 1999 | 466 |
| Built 1980 to 1989 | 182 |
| Built 1970 to 1979 | 22 |
| Built 1960 to 1969 | 19 |
| Built 1950 to 1959 | 0 |
| Built 1940 to 1949 | 9 |
| Built 1939 or earlier | 0 |
| Total housing units | 3,452 |
| 1 room | 42 |
| 2 rooms | 87 |
| 3 rooms | 228 |
| 4 rooms | 223 |
| 5 rooms | 925 |
| 6 rooms | 957 |
| 7 rooms | 519 |
| 8 rooms | 230 |
| 9 rooms or more | 241 |
| Median rooms | 5.7 |
| Total housing units | 3,452 |
| No bedroom | 42 |
| 1 bedroom | 264 |
| 2 bedrooms | 386 |
| 3 bedrooms | 1,928 |
| 4 bedrooms | 759 |
| 5 or more bedrooms | 73 |
| Occupied housing units | 3,353 |
| Owner-occupied | 2,017 |
| Renter-occupied | 1,336 |
| Average household size of owner-occupied unit | 2.92 |
| Average household size of renter-occupied unit | 2.98 |
| Occupied housing units | 3,353 |
| Moved in 2017 or later | 540 |
| Moved in 2015 to 2016 | 577 |
| Moved in 2010 to 2014 | 1,132 |
| Moved in 2000 to 2009 | 945 |
| Moved in 1990 to 1999 | 128 |
| Moved in 1989 and earlier | 31 |
| Owner-occupied units | 2,017 |
| Less than $50,000 | 16 |
| $50,000 to $99,999 | 0 |
| $100,000 to $149,999 | 581 |
| $150,000 to $199,999 | 798 |
| $200,000 to $299,999 | 417 |
| $300,000 to $499,999 | 174 |
| $500,000 to $999,999 | 31 |
| $1,000,000 or more | 0 |
| Median (dollars) | 173,900 |
| Owner-occupied units | 2,017 |
| Housing units with a mortgage | 1,559 |
| Housing units without a mortgage | 458 |
| Occupied units paying rent | 1,336 |
| Less than $500 | 0 |
| $500 to $999 | 166 |
| $1,000 to $1,499 | 680 |
| $1,500 to $1,999 | 490 |
| $2,000 to $2,499 | 0 |
| $2,500 to $2,999 | 0 |
| $3,000 or more | 0 |
| Median (dollars) | 1,404 |
| No rent paid | 0 |
Data is based on 2018 Census
ZIP Codes for other locations
State for SELMA
Texas ZIP CodesOther cities in Texas