SHERMAN, TX ZIP Code
| City | SHERMAN |
| State | Texas |
| ZIP Codes count | 3 (see all) |
| Post offices count | 1 (see all) |
| Total population | 41,149 (see all) |
ZIP Codes in SHERMAN, Texas
75090, 75091, 75092
This list contains only 5-digit ZIP codes. Use our zip code lookup by address feature to get the full 9-digit (ZIP+4) code.
List of SHERMAN, TX ZIP Codes
| ZIP | TYPE | POPU |
|---|---|---|
| 75090 | STANDARD | 24,866 |
| 75091 | PO BOX | – |
| 75092 | STANDARD | 26,794 |
Post offices
SHERMAN — Post Office™ 701 E PEYTON ST SHERMAN, TX 75090-9998 |
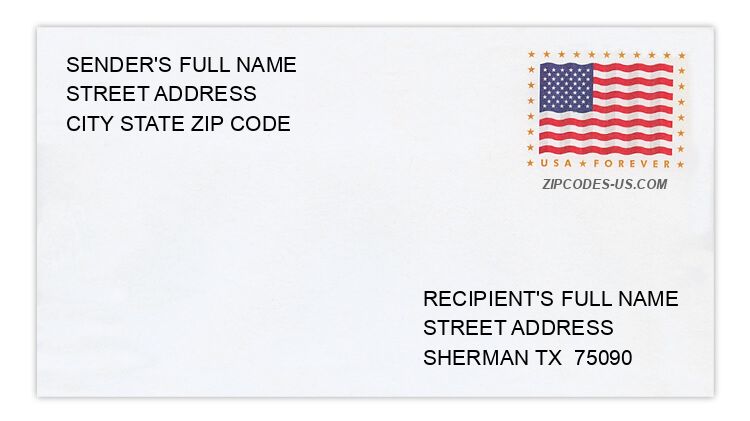
Envelope example
On the bottom center of the envelope, write the address you want your letter delivered to. Include the following on separate lines:
- Recipient's full name
- Full street address
- City, State, and ZIP Code
Using the same format, write the return address in the top left corner.
Using the full ZIP+4 Code when mailing via the USPS ensures the fastest, most accurate mailing possible. If you are not sure of the full 9-digit ZIP Code, use the 5-digit ZIP Code to avoid loss of letter or package.
The recipient address information is provided for your reference.
Address example
2959 BUTTERFIELD TRL
SHERMAN TX 75092-4482
SHERMAN TX 75092-4482
144 BYLER DR
SHERMAN TX 75092-8373
SHERMAN TX 75092-8373
36 CHOCTAW EST CIR
SHERMAN TX 75092-6970
SHERMAN TX 75092-6970
293 MCGRAW LN
SHERMAN TX 75090-3503
SHERMAN TX 75090-3503
123 S ELM ST
SHERMAN TX 75090-5811
SHERMAN TX 75090-5811
816 S LYON ST
SHERMAN TX 75092-7322
SHERMAN TX 75092-7322
Map
Hover over the map to see the ZIP code
Census data for SHERMAN, TX
Demographic and housing estimates in SHERMAN, TX
| Total population | 41,149 |
| Male | 19,878 |
| Female | 21,271 |
| Total population | 41,149 |
| Under 5 years | 3,071 |
| 5 to 9 years | 2,873 |
| 10 to 14 years | 3,053 |
| 15 to 19 years | 3,191 |
| 20 to 24 years | 2,950 |
| 25 to 34 years | 5,990 |
| 35 to 44 years | 5,308 |
| 45 to 54 years | 4,934 |
| 55 to 59 years | 2,233 |
| 60 to 64 years | 1,921 |
| 65 to 74 years | 3,348 |
| 75 to 84 years | 1,579 |
| 85 years and over | 698 |
| Median age (years) | 34.0 |
| Under 18 years | 10,710 |
| 16 years and over | 31,533 |
| 18 years and over | 30,439 |
| 21 years and over | 28,217 |
| 62 years and over | 6,717 |
| 65 years and over | 5,625 |
| Total population | 41,149 |
| One race | 39,265 |
| White | 32,590 |
| Black or African American | 4,156 |
| American Indian and Alaska Native | 263 |
| Asian | 1,065 |
| Native Hawaiian and Other Pacific Islander | 0 |
| Some other race | 1,191 |
| Two or more races | 1,884 |
| Citizen, VOTING AGE 18 and over population | 26,878 |
| Male Citizen, VOTING AGE 18 and over population | 12,489 |
| Female Citizen, VOTING AGE 18 and over population | 14,389 |
Social characteristics in SHERMAN, TX
| Total households | 14,939 |
| Family households (families) | 9,688 |
| Married-couple family | 6,474 |
| Male householder, no wife present, family | 764 |
| Female householder, no husband present, family | 2,450 |
| Nonfamily households | 5,251 |
| Average household size | 2.65 |
| Average family size | 3.28 |
Economic characteristics in SHERMAN, TX
| Total households | 14,939 |
| Less than $10,000 | 1,111 |
| $10,000 to $14,999 | 971 |
| $15,000 to $24,999 | 1,615 |
| $25,000 to $34,999 | 1,728 |
| $35,000 to $49,999 | 2,491 |
| $50,000 to $74,999 | 2,682 |
| $75,000 to $99,999 | 2,036 |
| $100,000 to $149,999 | 1,465 |
| $150,000 to $199,999 | 492 |
| $200,000 or more | 348 |
| Median household income (dollars) | 46,940 |
Housing characteristics in SHERMAN, TX
| Total housing units | 16,877 |
| Occupied housing units | 14,939 |
| Vacant housing units | 1,938 |
| Total housing units | 16,877 |
| 1-unit, detached | 11,679 |
| 1-unit, attached | 242 |
| 2 units | 636 |
| 3 or 4 units | 716 |
| 5 to 9 units | 1,265 |
| 10 to 19 units | 934 |
| 20 or more units | 1,042 |
| Mobile home | 343 |
| Boat, RV, van, etc. | 20 |
| Total housing units | 16,877 |
| Built 2014 or later | 355 |
| Built 2010 to 2013 | 436 |
| Built 2000 to 2009 | 2,464 |
| Built 1990 to 1999 | 1,354 |
| Built 1980 to 1989 | 2,005 |
| Built 1970 to 1979 | 2,429 |
| Built 1960 to 1969 | 3,067 |
| Built 1950 to 1959 | 2,063 |
| Built 1940 to 1949 | 1,161 |
| Built 1939 or earlier | 1,543 |
| Total housing units | 16,877 |
| 1 room | 425 |
| 2 rooms | 455 |
| 3 rooms | 1,612 |
| 4 rooms | 2,988 |
| 5 rooms | 3,543 |
| 6 rooms | 3,420 |
| 7 rooms | 2,143 |
| 8 rooms | 1,122 |
| 9 rooms or more | 1,169 |
| Median rooms | 5.3 |
| Total housing units | 16,877 |
| No bedroom | 441 |
| 1 bedroom | 2,113 |
| 2 bedrooms | 4,663 |
| 3 bedrooms | 7,570 |
| 4 bedrooms | 1,759 |
| 5 or more bedrooms | 331 |
| Occupied housing units | 14,939 |
| Owner-occupied | 7,819 |
| Renter-occupied | 7,120 |
| Average household size of owner-occupied unit | 2.73 |
| Average household size of renter-occupied unit | 2.55 |
| Occupied housing units | 14,939 |
| Moved in 2017 or later | 787 |
| Moved in 2015 to 2016 | 2,113 |
| Moved in 2010 to 2014 | 5,671 |
| Moved in 2000 to 2009 | 3,698 |
| Moved in 1990 to 1999 | 1,356 |
| Moved in 1989 and earlier | 1,314 |
| Owner-occupied units | 7,819 |
| Less than $50,000 | 927 |
| $50,000 to $99,999 | 2,536 |
| $100,000 to $149,999 | 1,532 |
| $150,000 to $199,999 | 1,232 |
| $200,000 to $299,999 | 814 |
| $300,000 to $499,999 | 641 |
| $500,000 to $999,999 | 125 |
| $1,000,000 or more | 12 |
| Median (dollars) | 114,200 |
| Owner-occupied units | 7,819 |
| Housing units with a mortgage | 3,902 |
| Housing units without a mortgage | 3,917 |
| Occupied units paying rent | 6,963 |
| Less than $500 | 431 |
| $500 to $999 | 4,325 |
| $1,000 to $1,499 | 1,741 |
| $1,500 to $1,999 | 303 |
| $2,000 to $2,499 | 37 |
| $2,500 to $2,999 | 0 |
| $3,000 or more | 126 |
| Median (dollars) | 872 |
| No rent paid | 157 |
Data is based on 2018 Census
ZIP Codes for other locations
State for SHERMAN
Texas ZIP CodesOther cities in Texas