SILSBEE, TX ZIP Code
| City | SILSBEE |
| State | Texas |
| ZIP Codes count | 1 (see all) |
| Post offices count | 1 (see all) |
| Total population | 6,640 (see all) |
ZIP Code in SILSBEE, Texas
77656
This list contains only 5-digit ZIP codes. Use our zip code lookup by address feature to get the full 9-digit (ZIP+4) code.
List of SILSBEE, TX ZIP Codes
| ZIP | TYPE | POPU |
|---|---|---|
| 77656 | STANDARD | 16,795 |
Post offices
SILSBEE — Post Office™ 111 W AVENUE P SILSBEE, TX 77656-9998 |
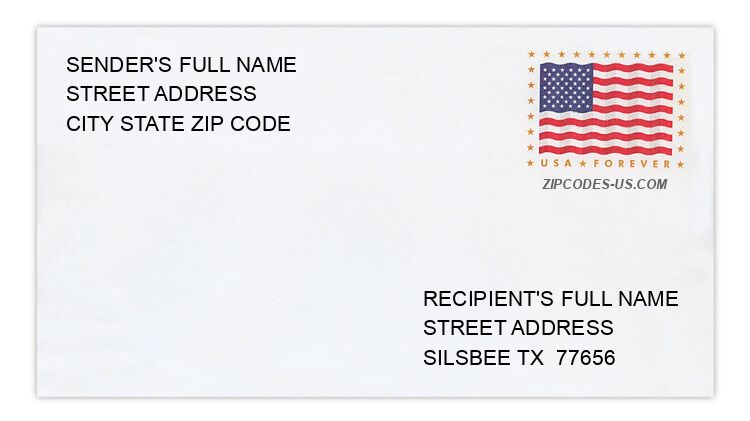
Envelope example
On the bottom center of the envelope, write the address you want your letter delivered to. Include the following on separate lines:
- Recipient's full name
- Full street address
- City, State, and ZIP Code
Using the same format, write the return address in the top left corner.
Using the full ZIP+4 Code when mailing via the USPS ensures the fastest, most accurate mailing possible. If you are not sure of the full 9-digit ZIP Code, use the 5-digit ZIP Code to avoid loss of letter or package.
The recipient address information is provided for your reference.
Address example
8311 ANDOVER DR
SILSBEE TX 77656-6259
SILSBEE TX 77656-6259
1982 J P WHITE DR
SILSBEE TX 77656-7512
SILSBEE TX 77656-7512
5678 MATTHEWS DR
SILSBEE TX 77656-6175
SILSBEE TX 77656-6175
6869 MCINTYRE LN
SILSBEE TX 77656-7554
SILSBEE TX 77656-7554
197 PRIVATE ROAD 8712
SILSBEE TX 77656-3670
SILSBEE TX 77656-3670
306 REDCUT RD
SILSBEE TX 77656-4222
SILSBEE TX 77656-4222
Map
Hover over the map to see the ZIP code
Census data for SILSBEE, TX
Demographic and housing estimates in SILSBEE, TX
| Total population | 6,640 |
| Male | 2,949 |
| Female | 3,691 |
| Total population | 6,640 |
| Under 5 years | 472 |
| 5 to 9 years | 553 |
| 10 to 14 years | 418 |
| 15 to 19 years | 394 |
| 20 to 24 years | 356 |
| 25 to 34 years | 814 |
| 35 to 44 years | 851 |
| 45 to 54 years | 599 |
| 55 to 59 years | 398 |
| 60 to 64 years | 434 |
| 65 to 74 years | 735 |
| 75 to 84 years | 371 |
| 85 years and over | 245 |
| Median age (years) | 38.3 |
| Under 18 years | 1,650 |
| 16 years and over | 5,084 |
| 18 years and over | 4,990 |
| 21 years and over | 4,735 |
| 62 years and over | 1,559 |
| 65 years and over | 1,351 |
| Total population | 6,640 |
| One race | 6,564 |
| White | 4,541 |
| Black or African American | 2,015 |
| American Indian and Alaska Native | 0 |
| Asian | 8 |
| Native Hawaiian and Other Pacific Islander | 0 |
| Some other race | 0 |
| Two or more races | 76 |
| Citizen, VOTING AGE 18 and over population | 4,939 |
| Male Citizen, VOTING AGE 18 and over population | 2,270 |
| Female Citizen, VOTING AGE 18 and over population | 2,669 |
Social characteristics in SILSBEE, TX
| Total households | 2,550 |
| Family households (families) | 1,539 |
| Married-couple family | 951 |
| Male householder, no wife present, family | 109 |
| Female householder, no husband present, family | 479 |
| Nonfamily households | 1,011 |
| Average household size | 2.48 |
| Average family size | 3.35 |
Economic characteristics in SILSBEE, TX
| Total households | 2,550 |
| Less than $10,000 | 359 |
| $10,000 to $14,999 | 422 |
| $15,000 to $24,999 | 209 |
| $25,000 to $34,999 | 219 |
| $35,000 to $49,999 | 380 |
| $50,000 to $74,999 | 415 |
| $75,000 to $99,999 | 177 |
| $100,000 to $149,999 | 249 |
| $150,000 to $199,999 | 39 |
| $200,000 or more | 81 |
| Median household income (dollars) | 38,448 |
Housing characteristics in SILSBEE, TX
| Total housing units | 3,091 |
| Occupied housing units | 2,550 |
| Vacant housing units | 541 |
| Total housing units | 3,091 |
| 1-unit, detached | 2,196 |
| 1-unit, attached | 87 |
| 2 units | 115 |
| 3 or 4 units | 61 |
| 5 to 9 units | 119 |
| 10 to 19 units | 105 |
| 20 or more units | 84 |
| Mobile home | 276 |
| Boat, RV, van, etc. | 48 |
| Total housing units | 3,091 |
| Built 2014 or later | 21 |
| Built 2010 to 2013 | 113 |
| Built 2000 to 2009 | 429 |
| Built 1990 to 1999 | 348 |
| Built 1980 to 1989 | 274 |
| Built 1970 to 1979 | 403 |
| Built 1960 to 1969 | 719 |
| Built 1950 to 1959 | 493 |
| Built 1940 to 1949 | 133 |
| Built 1939 or earlier | 158 |
| Total housing units | 3,091 |
| 1 room | 115 |
| 2 rooms | 189 |
| 3 rooms | 259 |
| 4 rooms | 485 |
| 5 rooms | 576 |
| 6 rooms | 713 |
| 7 rooms | 422 |
| 8 rooms | 196 |
| 9 rooms or more | 136 |
| Median rooms | 5.4 |
| Total housing units | 3,091 |
| No bedroom | 115 |
| 1 bedroom | 384 |
| 2 bedrooms | 829 |
| 3 bedrooms | 1,389 |
| 4 bedrooms | 295 |
| 5 or more bedrooms | 79 |
| Occupied housing units | 2,550 |
| Owner-occupied | 1,715 |
| Renter-occupied | 835 |
| Average household size of owner-occupied unit | 2.42 |
| Average household size of renter-occupied unit | 2.62 |
| Occupied housing units | 2,550 |
| Moved in 2017 or later | 193 |
| Moved in 2015 to 2016 | 264 |
| Moved in 2010 to 2014 | 753 |
| Moved in 2000 to 2009 | 700 |
| Moved in 1990 to 1999 | 265 |
| Moved in 1989 and earlier | 375 |
| Owner-occupied units | 1,715 |
| Less than $50,000 | 305 |
| $50,000 to $99,999 | 623 |
| $100,000 to $149,999 | 409 |
| $150,000 to $199,999 | 222 |
| $200,000 to $299,999 | 101 |
| $300,000 to $499,999 | 23 |
| $500,000 to $999,999 | 27 |
| $1,000,000 or more | 5 |
| Median (dollars) | 95,800 |
| Owner-occupied units | 1,715 |
| Housing units with a mortgage | 726 |
| Housing units without a mortgage | 989 |
| Occupied units paying rent | 821 |
| Less than $500 | 279 |
| $500 to $999 | 434 |
| $1,000 to $1,499 | 101 |
| $1,500 to $1,999 | 7 |
| $2,000 to $2,499 | 0 |
| $2,500 to $2,999 | 0 |
| $3,000 or more | 0 |
| Median (dollars) | 658 |
| No rent paid | 14 |
Data is based on 2018 Census
ZIP Codes for other locations
State for SILSBEE
Texas ZIP CodesOther cities in Texas