SOMERVILLE, TX ZIP Code
| City | SOMERVILLE |
| State | Texas |
| ZIP Codes count | 1 (see all) |
| Post offices count | 1 (see all) |
| Total population | 1,594 (see all) |
ZIP Code in SOMERVILLE, Texas
77879
This list contains only 5-digit ZIP codes. Use our zip code lookup by address feature to get the full 9-digit (ZIP+4) code.
List of SOMERVILLE, TX ZIP Codes
| ZIP | TYPE | POPU |
|---|---|---|
| 77879 | STANDARD | 5,162 |
Post offices
SOMERVILLE — Post Office™ 199 8TH ST SOMERVILLE, TX 77879-9802 |
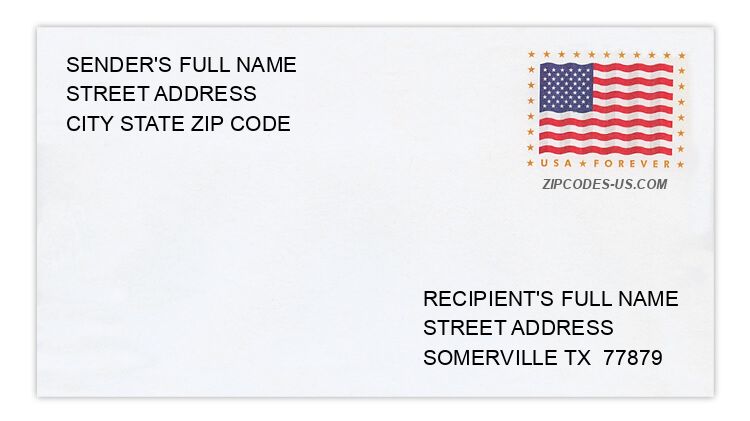
Envelope example
On the bottom center of the envelope, write the address you want your letter delivered to. Include the following on separate lines:
- Recipient's full name
- Full street address
- City, State, and ZIP Code
Using the same format, write the return address in the top left corner.
Using the full ZIP+4 Code when mailing via the USPS ensures the fastest, most accurate mailing possible. If you are not sure of the full 9-digit ZIP Code, use the 5-digit ZIP Code to avoid loss of letter or package.
The recipient address information is provided for your reference.
Address example
146 CHOCTAW CRST
SOMERVILLE TX 77879-3709
SOMERVILLE TX 77879-3709
663 PARK VIEW LN
SOMERVILLE TX 77879-4265
SOMERVILLE TX 77879-4265
17175 PRIVATE ROAD 4016
SOMERVILLE TX 77879-4120
SOMERVILLE TX 77879-4120
278 SAYERS CIR
SOMERVILLE TX 77879-5624
SOMERVILLE TX 77879-5624
466 W LOIS LN
SOMERVILLE TX 77879-5835
SOMERVILLE TX 77879-5835
117 W MAGNOLIA DR
SOMERVILLE TX 77879-4638
SOMERVILLE TX 77879-4638
Map
Hover over the map to see the ZIP code
Census data for SOMERVILLE, TX
Demographic and housing estimates in SOMERVILLE, TX
| Total population | 1,594 |
| Male | 688 |
| Female | 906 |
| Total population | 1,594 |
| Under 5 years | 170 |
| 5 to 9 years | 129 |
| 10 to 14 years | 91 |
| 15 to 19 years | 172 |
| 20 to 24 years | 161 |
| 25 to 34 years | 203 |
| 35 to 44 years | 112 |
| 45 to 54 years | 159 |
| 55 to 59 years | 71 |
| 60 to 64 years | 87 |
| 65 to 74 years | 117 |
| 75 to 84 years | 97 |
| 85 years and over | 25 |
| Median age (years) | 30.1 |
| Under 18 years | 478 |
| 16 years and over | 1,184 |
| 18 years and over | 1,116 |
| 21 years and over | 1,016 |
| 62 years and over | 298 |
| 65 years and over | 239 |
| Total population | 1,594 |
| One race | 1,533 |
| White | 950 |
| Black or African American | 408 |
| American Indian and Alaska Native | 28 |
| Asian | 0 |
| Native Hawaiian and Other Pacific Islander | 0 |
| Some other race | 147 |
| Two or more races | 61 |
| Citizen, VOTING AGE 18 and over population | 1,053 |
| Male Citizen, VOTING AGE 18 and over population | 463 |
| Female Citizen, VOTING AGE 18 and over population | 590 |
Social characteristics in SOMERVILLE, TX
| Total households | 589 |
| Family households (families) | 363 |
| Married-couple family | 220 |
| Male householder, no wife present, family | 21 |
| Female householder, no husband present, family | 122 |
| Nonfamily households | 226 |
| Average household size | 2.71 |
| Average family size | 3.61 |
Economic characteristics in SOMERVILLE, TX
| Total households | 589 |
| Less than $10,000 | 45 |
| $10,000 to $14,999 | 51 |
| $15,000 to $24,999 | 130 |
| $25,000 to $34,999 | 58 |
| $35,000 to $49,999 | 76 |
| $50,000 to $74,999 | 101 |
| $75,000 to $99,999 | 90 |
| $100,000 to $149,999 | 22 |
| $150,000 to $199,999 | 16 |
| $200,000 or more | 0 |
| Median household income (dollars) | 36,193 |
Housing characteristics in SOMERVILLE, TX
| Total housing units | 809 |
| Occupied housing units | 589 |
| Vacant housing units | 220 |
| Total housing units | 809 |
| 1-unit, detached | 591 |
| 1-unit, attached | 13 |
| 2 units | 46 |
| 3 or 4 units | 20 |
| 5 to 9 units | 0 |
| 10 to 19 units | 5 |
| 20 or more units | 0 |
| Mobile home | 134 |
| Boat, RV, van, etc. | 0 |
| Total housing units | 809 |
| Built 2014 or later | 0 |
| Built 2010 to 2013 | 25 |
| Built 2000 to 2009 | 50 |
| Built 1990 to 1999 | 121 |
| Built 1980 to 1989 | 164 |
| Built 1970 to 1979 | 193 |
| Built 1960 to 1969 | 53 |
| Built 1950 to 1959 | 74 |
| Built 1940 to 1949 | 28 |
| Built 1939 or earlier | 101 |
| Total housing units | 809 |
| 1 room | 0 |
| 2 rooms | 16 |
| 3 rooms | 57 |
| 4 rooms | 122 |
| 5 rooms | 229 |
| 6 rooms | 209 |
| 7 rooms | 142 |
| 8 rooms | 28 |
| 9 rooms or more | 6 |
| Median rooms | 5.4 |
| Total housing units | 809 |
| No bedroom | 0 |
| 1 bedroom | 81 |
| 2 bedrooms | 207 |
| 3 bedrooms | 396 |
| 4 bedrooms | 125 |
| 5 or more bedrooms | 0 |
| Occupied housing units | 589 |
| Owner-occupied | 376 |
| Renter-occupied | 213 |
| Average household size of owner-occupied unit | 2.54 |
| Average household size of renter-occupied unit | 3.00 |
| Occupied housing units | 589 |
| Moved in 2017 or later | 46 |
| Moved in 2015 to 2016 | 41 |
| Moved in 2010 to 2014 | 177 |
| Moved in 2000 to 2009 | 152 |
| Moved in 1990 to 1999 | 92 |
| Moved in 1989 and earlier | 81 |
| Owner-occupied units | 376 |
| Less than $50,000 | 64 |
| $50,000 to $99,999 | 194 |
| $100,000 to $149,999 | 56 |
| $150,000 to $199,999 | 47 |
| $200,000 to $299,999 | 15 |
| $300,000 to $499,999 | 0 |
| $500,000 to $999,999 | 0 |
| $1,000,000 or more | 0 |
| Median (dollars) | 77,700 |
| Owner-occupied units | 376 |
| Housing units with a mortgage | 150 |
| Housing units without a mortgage | 226 |
| Occupied units paying rent | 182 |
| Less than $500 | 32 |
| $500 to $999 | 121 |
| $1,000 to $1,499 | 29 |
| $1,500 to $1,999 | 0 |
| $2,000 to $2,499 | 0 |
| $2,500 to $2,999 | 0 |
| $3,000 or more | 0 |
| Median (dollars) | 710 |
| No rent paid | 31 |
Data is based on 2018 Census
ZIP Codes for other locations
State for SOMERVILLE
Texas ZIP CodesOther cities in Texas