SULPHUR SPRINGS, TX ZIP Code
| City | SULPHUR SPRINGS |
| State | Texas |
| ZIP Codes count | 2 (see all) |
| Post offices count | 1 (see all) |
| Total population | 15,948 (see all) |
ZIP Codes in SULPHUR SPRINGS, Texas
75482, 75483
This list contains only 5-digit ZIP codes. Use our zip code lookup by address feature to get the full 9-digit (ZIP+4) code.
List of SULPHUR SPRINGS, TX ZIP Codes
| ZIP | TYPE | POPU |
|---|---|---|
| 75482 | STANDARD | 25,220 |
| 75483 | PO BOX | – |
Post offices
SULPHUR SPRINGS — Post Office™ 320 CHURCH ST SULPHUR SPRINGS, TX 75482-9998 |
Envelope example
On the bottom center of the envelope, write the address you want your letter delivered to. Include the following on separate lines:
- Recipient's full name
- Full street address
- City, State, and ZIP Code
Using the same format, write the return address in the top left corner.
Using the full ZIP+4 Code when mailing via the USPS ensures the fastest, most accurate mailing possible. If you are not sure of the full 9-digit ZIP Code, use the 5-digit ZIP Code to avoid loss of letter or package.
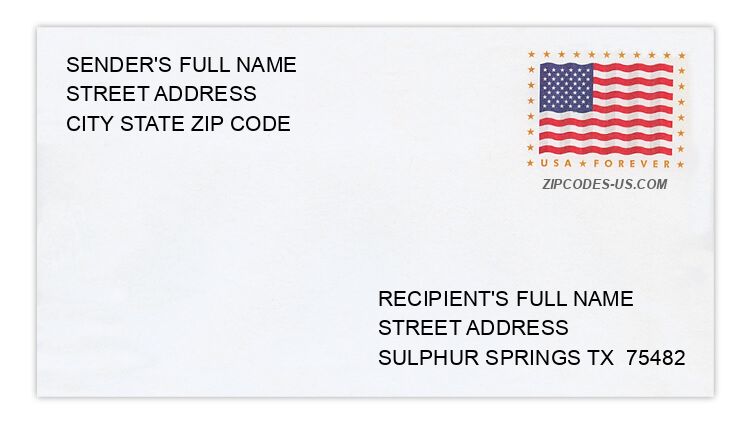
The recipient address information is provided for your reference.
Address example
516 COUNTY ROAD 1183
SULPHUR SPRINGS TX 75482-8470
SULPHUR SPRINGS TX 75482-8470
3034 COUNTY ROAD 2301
SULPHUR SPRINGS TX 75482-7833
SULPHUR SPRINGS TX 75482-7833
946 COUNTY ROAD 3345
SULPHUR SPRINGS TX 75482-8906
SULPHUR SPRINGS TX 75482-8906
4 COUNTY ROAD 3507 N
SULPHUR SPRINGS TX 75482-1508
SULPHUR SPRINGS TX 75482-1508
416 EASY ST
SULPHUR SPRINGS TX 75482-2582
SULPHUR SPRINGS TX 75482-2582
67 MITCHELL RD
SULPHUR SPRINGS TX 75482-7483
SULPHUR SPRINGS TX 75482-7483
Map
Hover over the map to see the ZIP code
Census data for SULPHUR SPRINGS, TX
Demographic and housing estimates in SULPHUR SPRINGS, TX
| Total population | 15,948 |
| Male | 7,526 |
| Female | 8,422 |
| Total population | 15,948 |
| Under 5 years | 1,134 |
| 5 to 9 years | 1,019 |
| 10 to 14 years | 1,182 |
| 15 to 19 years | 990 |
| 20 to 24 years | 1,101 |
| 25 to 34 years | 2,283 |
| 35 to 44 years | 1,752 |
| 45 to 54 years | 1,978 |
| 55 to 59 years | 754 |
| 60 to 64 years | 944 |
| 65 to 74 years | 1,583 |
| 75 to 84 years | 895 |
| 85 years and over | 333 |
| Median age (years) | 36.0 |
| Under 18 years | 3,987 |
| 16 years and over | 12,356 |
| 18 years and over | 11,961 |
| 21 years and over | 11,398 |
| 62 years and over | 3,138 |
| 65 years and over | 2,811 |
| Total population | 15,948 |
| One race | 15,491 |
| White | 12,659 |
| Black or African American | 1,987 |
| American Indian and Alaska Native | 0 |
| Asian | 123 |
| Native Hawaiian and Other Pacific Islander | 19 |
| Some other race | 703 |
| Two or more races | 457 |
| Citizen, VOTING AGE 18 and over population | 11,357 |
| Male Citizen, VOTING AGE 18 and over population | 5,182 |
| Female Citizen, VOTING AGE 18 and over population | 6,175 |
Social characteristics in SULPHUR SPRINGS, TX
| Total households | 6,101 |
| Family households (families) | 4,146 |
| Married-couple family | 2,736 |
| Male householder, no wife present, family | 350 |
| Female householder, no husband present, family | 1,060 |
| Nonfamily households | 1,955 |
| Average household size | 2.55 |
| Average family size | 3.06 |
Economic characteristics in SULPHUR SPRINGS, TX
| Total households | 6,101 |
| Less than $10,000 | 541 |
| $10,000 to $14,999 | 375 |
| $15,000 to $24,999 | 744 |
| $25,000 to $34,999 | 951 |
| $35,000 to $49,999 | 779 |
| $50,000 to $74,999 | 1,241 |
| $75,000 to $99,999 | 676 |
| $100,000 to $149,999 | 542 |
| $150,000 to $199,999 | 108 |
| $200,000 or more | 144 |
| Median household income (dollars) | 43,156 |
Housing characteristics in SULPHUR SPRINGS, TX
| Total housing units | 6,906 |
| Occupied housing units | 6,101 |
| Vacant housing units | 805 |
| Total housing units | 6,906 |
| 1-unit, detached | 5,115 |
| 1-unit, attached | 109 |
| 2 units | 80 |
| 3 or 4 units | 417 |
| 5 to 9 units | 596 |
| 10 to 19 units | 206 |
| 20 or more units | 312 |
| Mobile home | 71 |
| Boat, RV, van, etc. | 0 |
| Total housing units | 6,906 |
| Built 2014 or later | 27 |
| Built 2010 to 2013 | 330 |
| Built 2000 to 2009 | 530 |
| Built 1990 to 1999 | 563 |
| Built 1980 to 1989 | 1,273 |
| Built 1970 to 1979 | 1,585 |
| Built 1960 to 1969 | 843 |
| Built 1950 to 1959 | 728 |
| Built 1940 to 1949 | 374 |
| Built 1939 or earlier | 653 |
| Total housing units | 6,906 |
| 1 room | 89 |
| 2 rooms | 174 |
| 3 rooms | 697 |
| 4 rooms | 1,230 |
| 5 rooms | 1,905 |
| 6 rooms | 1,497 |
| 7 rooms | 681 |
| 8 rooms | 369 |
| 9 rooms or more | 264 |
| Median rooms | 5.2 |
| Total housing units | 6,906 |
| No bedroom | 104 |
| 1 bedroom | 808 |
| 2 bedrooms | 1,905 |
| 3 bedrooms | 3,591 |
| 4 bedrooms | 465 |
| 5 or more bedrooms | 33 |
| Occupied housing units | 6,101 |
| Owner-occupied | 3,276 |
| Renter-occupied | 2,825 |
| Average household size of owner-occupied unit | 2.53 |
| Average household size of renter-occupied unit | 2.57 |
| Occupied housing units | 6,101 |
| Moved in 2017 or later | 504 |
| Moved in 2015 to 2016 | 934 |
| Moved in 2010 to 2014 | 2,046 |
| Moved in 2000 to 2009 | 1,370 |
| Moved in 1990 to 1999 | 615 |
| Moved in 1989 and earlier | 632 |
| Owner-occupied units | 3,276 |
| Less than $50,000 | 625 |
| $50,000 to $99,999 | 1,210 |
| $100,000 to $149,999 | 655 |
| $150,000 to $199,999 | 435 |
| $200,000 to $299,999 | 205 |
| $300,000 to $499,999 | 110 |
| $500,000 to $999,999 | 24 |
| $1,000,000 or more | 12 |
| Median (dollars) | 93,100 |
| Owner-occupied units | 3,276 |
| Housing units with a mortgage | 1,461 |
| Housing units without a mortgage | 1,815 |
| Occupied units paying rent | 2,631 |
| Less than $500 | 328 |
| $500 to $999 | 1,676 |
| $1,000 to $1,499 | 570 |
| $1,500 to $1,999 | 40 |
| $2,000 to $2,499 | 0 |
| $2,500 to $2,999 | 0 |
| $3,000 or more | 17 |
| Median (dollars) | 779 |
| No rent paid | 194 |
Data is based on 2018 Census
ZIP Codes for other locations
State for SULPHUR SPRINGS
Texas ZIP CodesOther cities in Texas