SWEENY, TX ZIP Code
| City | SWEENY |
| State | Texas |
| ZIP Codes count | 1 (see all) |
| Post offices count | 2 (see all) |
| Total population | 3,739 (see all) |
ZIP Code in SWEENY, Texas
77480
This list contains only 5-digit ZIP codes. Use our zip code lookup by address feature to get the full 9-digit (ZIP+4) code.
List of SWEENY, TX ZIP Codes
| ZIP | TYPE | POPU |
|---|---|---|
| 77480 | STANDARD | 8,243 |
Post offices
BRAZORIA — Post Office™ 111 GAINES ST BRAZORIA, TX 77422-2119 |
SWEENY — Post Office™ 301 E 2ND ST SWEENY, TX 77480-9998 |
Envelope example
On the bottom center of the envelope, write the address you want your letter delivered to. Include the following on separate lines:
- Recipient's full name
- Full street address
- City, State, and ZIP Code
Using the same format, write the return address in the top left corner.
Using the full ZIP+4 Code when mailing via the USPS ensures the fastest, most accurate mailing possible. If you are not sure of the full 9-digit ZIP Code, use the 5-digit ZIP Code to avoid loss of letter or package.
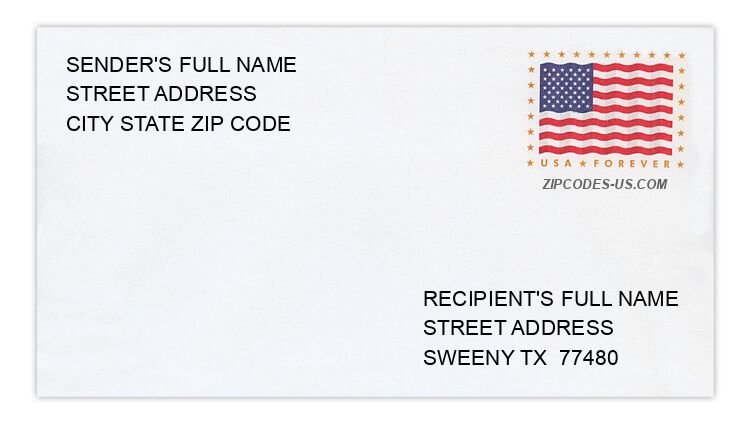
The recipient address information is provided for your reference.
Address example
7011 COUNTY ROAD 142
SWEENY TX 77480-8447
SWEENY TX 77480-8447
958 STEVENSON ST
SWEENY TX 77480-1434
SWEENY TX 77480-1434
7548 COUNTY ROAD 684D
SWEENY TX 77480-8030
SWEENY TX 77480-8030
91 PRIVATE ROAD 511
SWEENY TX 77480-8464
SWEENY TX 77480-8464
82 PRIVATE ROAD 511
SWEENY TX 77480-8506
SWEENY TX 77480-8506
7517 COUNTY ROAD 684D
SWEENY TX 77480-8031
SWEENY TX 77480-8031
Map
Hover over the map to see the ZIP code
Census data for SWEENY, TX
Demographic and housing estimates in SWEENY, TX
| Total population | 3,739 |
| Male | 2,045 |
| Female | 1,694 |
| Total population | 3,739 |
| Under 5 years | 343 |
| 5 to 9 years | 365 |
| 10 to 14 years | 210 |
| 15 to 19 years | 206 |
| 20 to 24 years | 362 |
| 25 to 34 years | 339 |
| 35 to 44 years | 314 |
| 45 to 54 years | 511 |
| 55 to 59 years | 202 |
| 60 to 64 years | 264 |
| 65 to 74 years | 314 |
| 75 to 84 years | 144 |
| 85 years and over | 165 |
| Median age (years) | 40.0 |
| Under 18 years | 1,033 |
| 16 years and over | 2,783 |
| 18 years and over | 2,706 |
| 21 years and over | 2,615 |
| 62 years and over | 823 |
| 65 years and over | 623 |
| Total population | 3,739 |
| One race | 3,739 |
| White | 3,126 |
| Black or African American | 514 |
| American Indian and Alaska Native | 0 |
| Asian | 0 |
| Native Hawaiian and Other Pacific Islander | 0 |
| Some other race | 99 |
| Two or more races | 0 |
| Citizen, VOTING AGE 18 and over population | 2,591 |
| Male Citizen, VOTING AGE 18 and over population | 1,269 |
| Female Citizen, VOTING AGE 18 and over population | 1,322 |
Social characteristics in SWEENY, TX
| Total households | 1,342 |
| Family households (families) | 960 |
| Married-couple family | 653 |
| Male householder, no wife present, family | 174 |
| Female householder, no husband present, family | 133 |
| Nonfamily households | 382 |
| Average household size | 2.72 |
| Average family size | 3.19 |
Economic characteristics in SWEENY, TX
| Total households | 1,342 |
| Less than $10,000 | 181 |
| $10,000 to $14,999 | 12 |
| $15,000 to $24,999 | 80 |
| $25,000 to $34,999 | 179 |
| $35,000 to $49,999 | 66 |
| $50,000 to $74,999 | 263 |
| $75,000 to $99,999 | 280 |
| $100,000 to $149,999 | 150 |
| $150,000 to $199,999 | 40 |
| $200,000 or more | 91 |
| Median household income (dollars) | 59,767 |
Housing characteristics in SWEENY, TX
| Total housing units | 1,617 |
| Occupied housing units | 1,342 |
| Vacant housing units | 275 |
| Total housing units | 1,617 |
| 1-unit, detached | 1,054 |
| 1-unit, attached | 0 |
| 2 units | 19 |
| 3 or 4 units | 90 |
| 5 to 9 units | 47 |
| 10 to 19 units | 124 |
| 20 or more units | 155 |
| Mobile home | 128 |
| Boat, RV, van, etc. | 0 |
| Total housing units | 1,617 |
| Built 2014 or later | 0 |
| Built 2010 to 2013 | 68 |
| Built 2000 to 2009 | 210 |
| Built 1990 to 1999 | 135 |
| Built 1980 to 1989 | 127 |
| Built 1970 to 1979 | 397 |
| Built 1960 to 1969 | 191 |
| Built 1950 to 1959 | 388 |
| Built 1940 to 1949 | 48 |
| Built 1939 or earlier | 53 |
| Total housing units | 1,617 |
| 1 room | 92 |
| 2 rooms | 0 |
| 3 rooms | 162 |
| 4 rooms | 150 |
| 5 rooms | 506 |
| 6 rooms | 424 |
| 7 rooms | 178 |
| 8 rooms | 31 |
| 9 rooms or more | 74 |
| Median rooms | 5.3 |
| Total housing units | 1,617 |
| No bedroom | 92 |
| 1 bedroom | 261 |
| 2 bedrooms | 250 |
| 3 bedrooms | 859 |
| 4 bedrooms | 103 |
| 5 or more bedrooms | 52 |
| Occupied housing units | 1,342 |
| Owner-occupied | 913 |
| Renter-occupied | 429 |
| Average household size of owner-occupied unit | 2.71 |
| Average household size of renter-occupied unit | 2.74 |
| Occupied housing units | 1,342 |
| Moved in 2017 or later | 0 |
| Moved in 2015 to 2016 | 118 |
| Moved in 2010 to 2014 | 410 |
| Moved in 2000 to 2009 | 387 |
| Moved in 1990 to 1999 | 162 |
| Moved in 1989 and earlier | 265 |
| Owner-occupied units | 913 |
| Less than $50,000 | 78 |
| $50,000 to $99,999 | 342 |
| $100,000 to $149,999 | 279 |
| $150,000 to $199,999 | 172 |
| $200,000 to $299,999 | 19 |
| $300,000 to $499,999 | 23 |
| $500,000 to $999,999 | 0 |
| $1,000,000 or more | 0 |
| Median (dollars) | 103,700 |
| Owner-occupied units | 913 |
| Housing units with a mortgage | 315 |
| Housing units without a mortgage | 598 |
| Occupied units paying rent | 382 |
| Less than $500 | 41 |
| $500 to $999 | 151 |
| $1,000 to $1,499 | 114 |
| $1,500 to $1,999 | 19 |
| $2,000 to $2,499 | 0 |
| $2,500 to $2,999 | 57 |
| $3,000 or more | 0 |
| Median (dollars) | 895 |
| No rent paid | 47 |
Data is based on 2018 Census
ZIP Codes for other locations
State for SWEENY
Texas ZIP CodesOther cities in Texas