TULIA, TX ZIP Code
| City | TULIA |
| State | Texas |
| ZIP Codes count | 1 (see all) |
| Post offices count | 1 (see all) |
| Total population | 4,706 (see all) |
ZIP Code in TULIA, Texas
79088
This list contains only 5-digit ZIP codes. Use our zip code lookup by address feature to get the full 9-digit (ZIP+4) code.
List of TULIA, TX ZIP Codes
| ZIP | TYPE | POPU |
|---|---|---|
| 79088 | STANDARD | 5,213 |
Post offices
TULIA — Post Office™ 129 N ARMSTRONG AVE TULIA, TX 79088-9998 |
Envelope example
On the bottom center of the envelope, write the address you want your letter delivered to. Include the following on separate lines:
- Recipient's full name
- Full street address
- City, State, and ZIP Code
Using the same format, write the return address in the top left corner.
Using the full ZIP+4 Code when mailing via the USPS ensures the fastest, most accurate mailing possible. If you are not sure of the full 9-digit ZIP Code, use the 5-digit ZIP Code to avoid loss of letter or package.
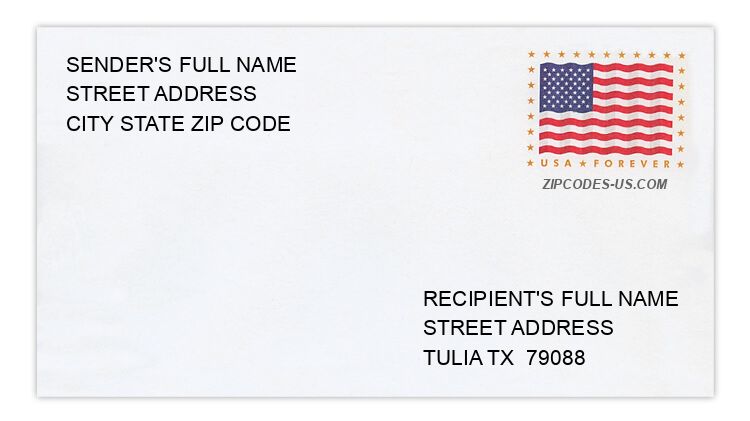
The recipient address information is provided for your reference.
Address example
388 BUFFALO TRL
TULIA TX 79088-3104
TULIA TX 79088-3104
2976 COUNTY ROAD 610
TULIA TX 79088-2911
TULIA TX 79088-2911
7683 COUNTY ROAD F
TULIA TX 79088-4704
TULIA TX 79088-4704
1046 LYNN ST
TULIA TX 79088-1034
TULIA TX 79088-1034
523 NE 4TH ST
TULIA TX 79088-2411
TULIA TX 79088-2411
803 SE 2ND ST
TULIA TX 79088-6334
TULIA TX 79088-6334
Map
Hover over the map to see the ZIP code
Census data for TULIA, TX
Demographic and housing estimates in TULIA, TX
| Total population | 4,706 |
| Male | 2,536 |
| Female | 2,170 |
| Total population | 4,706 |
| Under 5 years | 317 |
| 5 to 9 years | 335 |
| 10 to 14 years | 374 |
| 15 to 19 years | 302 |
| 20 to 24 years | 112 |
| 25 to 34 years | 913 |
| 35 to 44 years | 632 |
| 45 to 54 years | 398 |
| 55 to 59 years | 278 |
| 60 to 64 years | 282 |
| 65 to 74 years | 356 |
| 75 to 84 years | 251 |
| 85 years and over | 156 |
| Median age (years) | 35.0 |
| Under 18 years | 1,253 |
| 16 years and over | 3,605 |
| 18 years and over | 3,453 |
| 21 years and over | 3,354 |
| 62 years and over | 983 |
| 65 years and over | 763 |
| Total population | 4,706 |
| One race | 4,255 |
| White | 3,522 |
| Black or African American | 357 |
| American Indian and Alaska Native | 247 |
| Asian | 9 |
| Native Hawaiian and Other Pacific Islander | 8 |
| Some other race | 112 |
| Two or more races | 451 |
| Citizen, VOTING AGE 18 and over population | 3,076 |
| Male Citizen, VOTING AGE 18 and over population | 1,667 |
| Female Citizen, VOTING AGE 18 and over population | 1,409 |
Social characteristics in TULIA, TX
| Total households | 1,459 |
| Family households (families) | 1,031 |
| Married-couple family | 679 |
| Male householder, no wife present, family | 35 |
| Female householder, no husband present, family | 317 |
| Nonfamily households | 428 |
| Average household size | 2.77 |
| Average family size | 3.42 |
Economic characteristics in TULIA, TX
| Total households | 1,459 |
| Less than $10,000 | 214 |
| $10,000 to $14,999 | 94 |
| $15,000 to $24,999 | 298 |
| $25,000 to $34,999 | 192 |
| $35,000 to $49,999 | 204 |
| $50,000 to $74,999 | 198 |
| $75,000 to $99,999 | 141 |
| $100,000 to $149,999 | 64 |
| $150,000 to $199,999 | 39 |
| $200,000 or more | 15 |
| Median household income (dollars) | 31,853 |
Housing characteristics in TULIA, TX
| Total housing units | 1,799 |
| Occupied housing units | 1,459 |
| Vacant housing units | 340 |
| Total housing units | 1,799 |
| 1-unit, detached | 1,484 |
| 1-unit, attached | 14 |
| 2 units | 84 |
| 3 or 4 units | 102 |
| 5 to 9 units | 9 |
| 10 to 19 units | 0 |
| 20 or more units | 5 |
| Mobile home | 101 |
| Boat, RV, van, etc. | 0 |
| Total housing units | 1,799 |
| Built 2014 or later | 0 |
| Built 2010 to 2013 | 17 |
| Built 2000 to 2009 | 8 |
| Built 1990 to 1999 | 109 |
| Built 1980 to 1989 | 233 |
| Built 1970 to 1979 | 180 |
| Built 1960 to 1969 | 410 |
| Built 1950 to 1959 | 400 |
| Built 1940 to 1949 | 231 |
| Built 1939 or earlier | 211 |
| Total housing units | 1,799 |
| 1 room | 35 |
| 2 rooms | 8 |
| 3 rooms | 83 |
| 4 rooms | 426 |
| 5 rooms | 519 |
| 6 rooms | 403 |
| 7 rooms | 182 |
| 8 rooms | 102 |
| 9 rooms or more | 41 |
| Median rooms | 5.2 |
| Total housing units | 1,799 |
| No bedroom | 35 |
| 1 bedroom | 87 |
| 2 bedrooms | 628 |
| 3 bedrooms | 838 |
| 4 bedrooms | 203 |
| 5 or more bedrooms | 8 |
| Occupied housing units | 1,459 |
| Owner-occupied | 959 |
| Renter-occupied | 500 |
| Average household size of owner-occupied unit | 2.65 |
| Average household size of renter-occupied unit | 2.99 |
| Occupied housing units | 1,459 |
| Moved in 2017 or later | 38 |
| Moved in 2015 to 2016 | 295 |
| Moved in 2010 to 2014 | 409 |
| Moved in 2000 to 2009 | 298 |
| Moved in 1990 to 1999 | 128 |
| Moved in 1989 and earlier | 291 |
| Owner-occupied units | 959 |
| Less than $50,000 | 264 |
| $50,000 to $99,999 | 541 |
| $100,000 to $149,999 | 68 |
| $150,000 to $199,999 | 72 |
| $200,000 to $299,999 | 8 |
| $300,000 to $499,999 | 0 |
| $500,000 to $999,999 | 0 |
| $1,000,000 or more | 6 |
| Median (dollars) | 67,400 |
| Owner-occupied units | 959 |
| Housing units with a mortgage | 448 |
| Housing units without a mortgage | 511 |
| Occupied units paying rent | 444 |
| Less than $500 | 154 |
| $500 to $999 | 243 |
| $1,000 to $1,499 | 31 |
| $1,500 to $1,999 | 16 |
| $2,000 to $2,499 | 0 |
| $2,500 to $2,999 | 0 |
| $3,000 or more | 0 |
| Median (dollars) | 708 |
| No rent paid | 56 |
Data is based on 2018 Census
ZIP Codes for other locations
State for TULIA
Texas ZIP CodesOther cities in Texas