WIMBERLEY, TX ZIP Code
| City | WIMBERLEY |
| State | Texas |
| ZIP Codes count | 1 (see all) |
| Post offices count | 1 (see all) |
| Total population | 2,923 (see all) |
ZIP Code in WIMBERLEY, Texas
78676
This list contains only 5-digit ZIP codes. Use our zip code lookup by address feature to get the full 9-digit (ZIP+4) code.
List of WIMBERLEY, TX ZIP Codes
| ZIP | TYPE | POPU |
|---|---|---|
| 78676 | STANDARD | 15,241 |
Post offices
WIMBERLEY — Post Office™ 111 JOE WIMBERLEY BLVD WIMBERLEY, TX 78676-9998 |
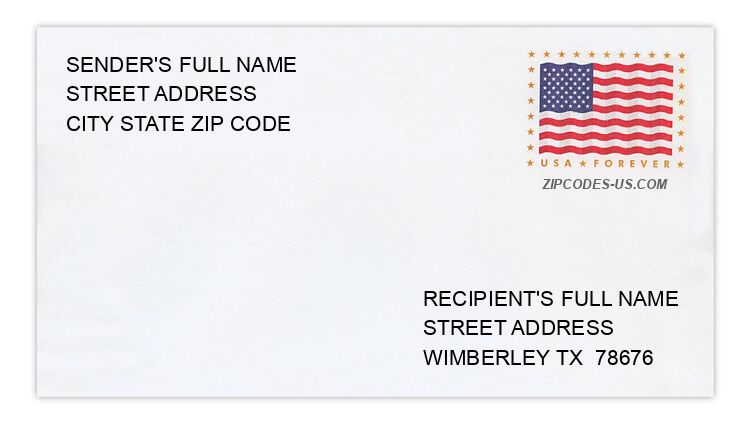
Envelope example
On the bottom center of the envelope, write the address you want your letter delivered to. Include the following on separate lines:
- Recipient's full name
- Full street address
- City, State, and ZIP Code
Using the same format, write the return address in the top left corner.
Using the full ZIP+4 Code when mailing via the USPS ensures the fastest, most accurate mailing possible. If you are not sure of the full 9-digit ZIP Code, use the 5-digit ZIP Code to avoid loss of letter or package.
The recipient address information is provided for your reference.
Address example
292 JOE WIMBERLEY BLVD
WIMBERLEY TX 78676-5908
WIMBERLEY TX 78676-5908
62 MIDLAND ST
WIMBERLEY TX 78676-2118
WIMBERLEY TX 78676-2118
37 OLD SHAWNEE TRL
WIMBERLEY TX 78676-3424
WIMBERLEY TX 78676-3424
111 SENDERO ARBOLADO
WIMBERLEY TX 78676-5829
WIMBERLEY TX 78676-5829
1920 SUMMIT LOOP
WIMBERLEY TX 78676-6497
WIMBERLEY TX 78676-6497
86 WOOD GLEN DR
WIMBERLEY TX 78676-2311
WIMBERLEY TX 78676-2311
Map
Hover over the map to see the ZIP code
Census data for WIMBERLEY, TX
Demographic and housing estimates in WIMBERLEY, TX
| Total population | 2,923 |
| Male | 1,424 |
| Female | 1,499 |
| Total population | 2,923 |
| Under 5 years | 81 |
| 5 to 9 years | 137 |
| 10 to 14 years | 108 |
| 15 to 19 years | 135 |
| 20 to 24 years | 49 |
| 25 to 34 years | 186 |
| 35 to 44 years | 213 |
| 45 to 54 years | 463 |
| 55 to 59 years | 390 |
| 60 to 64 years | 278 |
| 65 to 74 years | 483 |
| 75 to 84 years | 345 |
| 85 years and over | 55 |
| Median age (years) | 56.3 |
| Under 18 years | 402 |
| 16 years and over | 2,548 |
| 18 years and over | 2,521 |
| 21 years and over | 2,451 |
| 62 years and over | 1,034 |
| 65 years and over | 883 |
| Total population | 2,923 |
| One race | 2,847 |
| White | 2,720 |
| Black or African American | 0 |
| American Indian and Alaska Native | 7 |
| Asian | 9 |
| Native Hawaiian and Other Pacific Islander | 0 |
| Some other race | 111 |
| Two or more races | 76 |
| Citizen, VOTING AGE 18 and over population | 2,441 |
| Male Citizen, VOTING AGE 18 and over population | 1,132 |
| Female Citizen, VOTING AGE 18 and over population | 1,309 |
Social characteristics in WIMBERLEY, TX
| Total households | 1,296 |
| Family households (families) | 840 |
| Married-couple family | 782 |
| Male householder, no wife present, family | 0 |
| Female householder, no husband present, family | 58 |
| Nonfamily households | 456 |
| Average household size | 2.18 |
| Average family size | 2.75 |
Economic characteristics in WIMBERLEY, TX
| Total households | 1,296 |
| Less than $10,000 | 96 |
| $10,000 to $14,999 | 0 |
| $15,000 to $24,999 | 181 |
| $25,000 to $34,999 | 49 |
| $35,000 to $49,999 | 186 |
| $50,000 to $74,999 | 197 |
| $75,000 to $99,999 | 202 |
| $100,000 to $149,999 | 146 |
| $150,000 to $199,999 | 123 |
| $200,000 or more | 116 |
| Median household income (dollars) | 63,295 |
Housing characteristics in WIMBERLEY, TX
| Total housing units | 1,607 |
| Occupied housing units | 1,296 |
| Vacant housing units | 311 |
| Total housing units | 1,607 |
| 1-unit, detached | 1,359 |
| 1-unit, attached | 11 |
| 2 units | 22 |
| 3 or 4 units | 0 |
| 5 to 9 units | 97 |
| 10 to 19 units | 0 |
| 20 or more units | 5 |
| Mobile home | 113 |
| Boat, RV, van, etc. | 0 |
| Total housing units | 1,607 |
| Built 2014 or later | 47 |
| Built 2010 to 2013 | 48 |
| Built 2000 to 2009 | 226 |
| Built 1990 to 1999 | 325 |
| Built 1980 to 1989 | 310 |
| Built 1970 to 1979 | 375 |
| Built 1960 to 1969 | 116 |
| Built 1950 to 1959 | 72 |
| Built 1940 to 1949 | 38 |
| Built 1939 or earlier | 50 |
| Total housing units | 1,607 |
| 1 room | 21 |
| 2 rooms | 22 |
| 3 rooms | 250 |
| 4 rooms | 295 |
| 5 rooms | 334 |
| 6 rooms | 228 |
| 7 rooms | 147 |
| 8 rooms | 221 |
| 9 rooms or more | 89 |
| Median rooms | 5.1 |
| Total housing units | 1,607 |
| No bedroom | 21 |
| 1 bedroom | 92 |
| 2 bedrooms | 574 |
| 3 bedrooms | 651 |
| 4 bedrooms | 238 |
| 5 or more bedrooms | 31 |
| Occupied housing units | 1,296 |
| Owner-occupied | 988 |
| Renter-occupied | 308 |
| Average household size of owner-occupied unit | 2.27 |
| Average household size of renter-occupied unit | 1.87 |
| Occupied housing units | 1,296 |
| Moved in 2017 or later | 29 |
| Moved in 2015 to 2016 | 177 |
| Moved in 2010 to 2014 | 339 |
| Moved in 2000 to 2009 | 308 |
| Moved in 1990 to 1999 | 287 |
| Moved in 1989 and earlier | 156 |
| Owner-occupied units | 988 |
| Less than $50,000 | 0 |
| $50,000 to $99,999 | 94 |
| $100,000 to $149,999 | 81 |
| $150,000 to $199,999 | 98 |
| $200,000 to $299,999 | 274 |
| $300,000 to $499,999 | 157 |
| $500,000 to $999,999 | 224 |
| $1,000,000 or more | 60 |
| Median (dollars) | 283,800 |
| Owner-occupied units | 988 |
| Housing units with a mortgage | 521 |
| Housing units without a mortgage | 467 |
| Occupied units paying rent | 308 |
| Less than $500 | 5 |
| $500 to $999 | 146 |
| $1,000 to $1,499 | 140 |
| $1,500 to $1,999 | 17 |
| $2,000 to $2,499 | 0 |
| $2,500 to $2,999 | 0 |
| $3,000 or more | 0 |
| Median (dollars) | 1,017 |
| No rent paid | 0 |
Data is based on 2018 Census
ZIP Codes for other locations
State for WIMBERLEY
Texas ZIP CodesOther cities in Texas