WINNIE, TX ZIP Code
| City | WINNIE |
| State | Texas |
| ZIP Codes count | 1 (see all) |
| Post offices count | 1 (see all) |
| Total population | 3,482 (see all) |
ZIP Code in WINNIE, Texas
77665
This list contains only 5-digit ZIP codes. Use our zip code lookup by address feature to get the full 9-digit (ZIP+4) code.
List of WINNIE, TX ZIP Codes
| ZIP | TYPE | POPU |
|---|---|---|
| 77665 | STANDARD | 6,499 |
Post offices
WINNIE — Post Office™ 324 HIGHWAY 124 WINNIE, TX 77665-0190 |
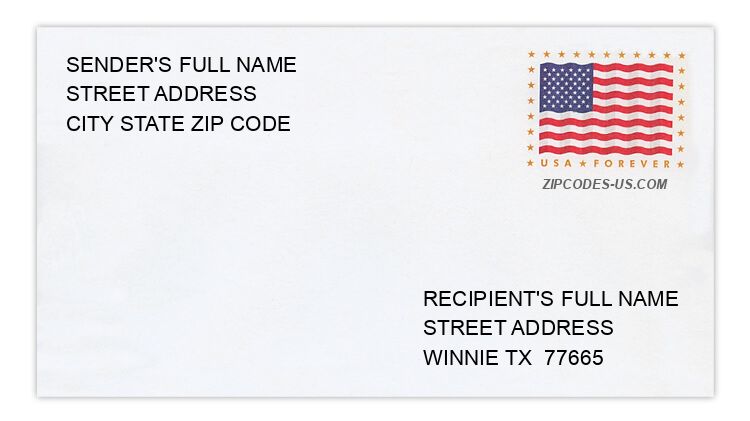
Envelope example
On the bottom center of the envelope, write the address you want your letter delivered to. Include the following on separate lines:
- Recipient's full name
- Full street address
- City, State, and ZIP Code
Using the same format, write the return address in the top left corner.
Using the full ZIP+4 Code when mailing via the USPS ensures the fastest, most accurate mailing possible. If you are not sure of the full 9-digit ZIP Code, use the 5-digit ZIP Code to avoid loss of letter or package.
The recipient address information is provided for your reference.
Address example
404 BERTRAND ST
WINNIE TX 77665-2377
WINNIE TX 77665-2377
403 BLUE BONNETT
WINNIE TX 77665-2350
WINNIE TX 77665-2350
190 E LEBLANC ST
WINNIE TX 77665-7448
WINNIE TX 77665-7448
1798 FM 1406 RD
WINNIE TX 77665-8968
WINNIE TX 77665-8968
392 N CAMPBELL RD
WINNIE TX 77665-8896
WINNIE TX 77665-8896
1036 VERBOOM RD
WINNIE TX 77665-4502
WINNIE TX 77665-4502
Map
Hover over the map to see the ZIP code
Census data for WINNIE, TX
Demographic and housing estimates in WINNIE, TX
| Total population | 3,482 |
| Male | 1,637 |
| Female | 1,845 |
| Total population | 3,482 |
| Under 5 years | 145 |
| 5 to 9 years | 267 |
| 10 to 14 years | 199 |
| 15 to 19 years | 260 |
| 20 to 24 years | 129 |
| 25 to 34 years | 452 |
| 35 to 44 years | 455 |
| 45 to 54 years | 370 |
| 55 to 59 years | 192 |
| 60 to 64 years | 408 |
| 65 to 74 years | 368 |
| 75 to 84 years | 133 |
| 85 years and over | 104 |
| Median age (years) | 39.8 |
| Under 18 years | 720 |
| 16 years and over | 2,824 |
| 18 years and over | 2,762 |
| 21 years and over | 2,611 |
| 62 years and over | 865 |
| 65 years and over | 605 |
| Total population | 3,482 |
| One race | 3,438 |
| White | 3,322 |
| Black or African American | 90 |
| American Indian and Alaska Native | 9 |
| Asian | 17 |
| Native Hawaiian and Other Pacific Islander | 0 |
| Some other race | 0 |
| Two or more races | 44 |
| Citizen, VOTING AGE 18 and over population | 2,551 |
| Male Citizen, VOTING AGE 18 and over population | 1,248 |
| Female Citizen, VOTING AGE 18 and over population | 1,303 |
Social characteristics in WINNIE, TX
| Total households | 1,348 |
| Family households (families) | 794 |
| Married-couple family | 636 |
| Male householder, no wife present, family | 77 |
| Female householder, no husband present, family | 81 |
| Nonfamily households | 554 |
| Average household size | 2.50 |
| Average family size | 3.35 |
Economic characteristics in WINNIE, TX
| Total households | 1,348 |
| Less than $10,000 | 47 |
| $10,000 to $14,999 | 97 |
| $15,000 to $24,999 | 175 |
| $25,000 to $34,999 | 272 |
| $35,000 to $49,999 | 133 |
| $50,000 to $74,999 | 111 |
| $75,000 to $99,999 | 233 |
| $100,000 to $149,999 | 104 |
| $150,000 to $199,999 | 130 |
| $200,000 or more | 46 |
| Median household income (dollars) | 46,560 |
Housing characteristics in WINNIE, TX
| Total housing units | 1,670 |
| Occupied housing units | 1,348 |
| Vacant housing units | 322 |
| Total housing units | 1,670 |
| 1-unit, detached | 1,026 |
| 1-unit, attached | 0 |
| 2 units | 50 |
| 3 or 4 units | 0 |
| 5 to 9 units | 86 |
| 10 to 19 units | 0 |
| 20 or more units | 16 |
| Mobile home | 492 |
| Boat, RV, van, etc. | 0 |
| Total housing units | 1,670 |
| Built 2014 or later | 0 |
| Built 2010 to 2013 | 12 |
| Built 2000 to 2009 | 305 |
| Built 1990 to 1999 | 437 |
| Built 1980 to 1989 | 150 |
| Built 1970 to 1979 | 164 |
| Built 1960 to 1969 | 354 |
| Built 1950 to 1959 | 145 |
| Built 1940 to 1949 | 53 |
| Built 1939 or earlier | 50 |
| Total housing units | 1,670 |
| 1 room | 0 |
| 2 rooms | 0 |
| 3 rooms | 190 |
| 4 rooms | 293 |
| 5 rooms | 693 |
| 6 rooms | 270 |
| 7 rooms | 117 |
| 8 rooms | 60 |
| 9 rooms or more | 47 |
| Median rooms | 5.0 |
| Total housing units | 1,670 |
| No bedroom | 0 |
| 1 bedroom | 94 |
| 2 bedrooms | 551 |
| 3 bedrooms | 930 |
| 4 bedrooms | 79 |
| 5 or more bedrooms | 16 |
| Occupied housing units | 1,348 |
| Owner-occupied | 864 |
| Renter-occupied | 484 |
| Average household size of owner-occupied unit | 2.72 |
| Average household size of renter-occupied unit | 2.11 |
| Occupied housing units | 1,348 |
| Moved in 2017 or later | 0 |
| Moved in 2015 to 2016 | 172 |
| Moved in 2010 to 2014 | 348 |
| Moved in 2000 to 2009 | 460 |
| Moved in 1990 to 1999 | 213 |
| Moved in 1989 and earlier | 155 |
| Owner-occupied units | 864 |
| Less than $50,000 | 249 |
| $50,000 to $99,999 | 158 |
| $100,000 to $149,999 | 146 |
| $150,000 to $199,999 | 140 |
| $200,000 to $299,999 | 146 |
| $300,000 to $499,999 | 9 |
| $500,000 to $999,999 | 16 |
| $1,000,000 or more | 0 |
| Median (dollars) | 110,100 |
| Owner-occupied units | 864 |
| Housing units with a mortgage | 371 |
| Housing units without a mortgage | 493 |
| Occupied units paying rent | 484 |
| Less than $500 | 66 |
| $500 to $999 | 292 |
| $1,000 to $1,499 | 126 |
| $1,500 to $1,999 | 0 |
| $2,000 to $2,499 | 0 |
| $2,500 to $2,999 | 0 |
| $3,000 or more | 0 |
| Median (dollars) | 919 |
| No rent paid | 0 |
Data is based on 2018 Census
ZIP Codes for other locations
State for WINNIE
Texas ZIP CodesOther cities in Texas