WYLIE, TX ZIP Code
| City | WYLIE |
| State | Texas |
| ZIP Codes count | 1 (see all) |
| Post offices count | 1 (see all) |
| Total population | 49,248 (see all) |
ZIP Code in WYLIE, Texas
75098
This list contains only 5-digit ZIP codes. Use our zip code lookup by address feature to get the full 9-digit (ZIP+4) code.
List of WYLIE, TX ZIP Codes
| ZIP | TYPE | POPU |
|---|---|---|
| 75098 | STANDARD | 64,326 |
Post offices
WYLIE — Post Office™ 940 W FM 544 WYLIE, TX 75098-5157 |
Envelope example
On the bottom center of the envelope, write the address you want your letter delivered to. Include the following on separate lines:
- Recipient's full name
- Full street address
- City, State, and ZIP Code
Using the same format, write the return address in the top left corner.
Using the full ZIP+4 Code when mailing via the USPS ensures the fastest, most accurate mailing possible. If you are not sure of the full 9-digit ZIP Code, use the 5-digit ZIP Code to avoid loss of letter or package.
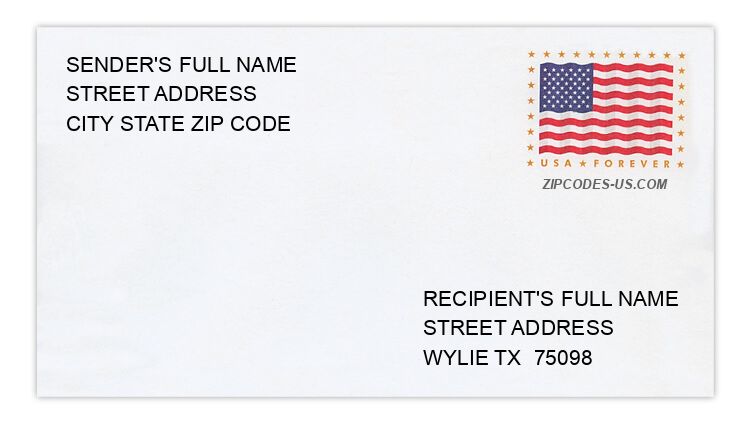
The recipient address information is provided for your reference.
Address example
1183 CEDAR LAKE CT
WYLIE TX 75098-4899
WYLIE TX 75098-4899
521 E GASTON DR
WYLIE TX 75098-4530
WYLIE TX 75098-4530
2804 LAKE VISTA DR
WYLIE TX 75098-6402
WYLIE TX 75098-6402
184 PLAINVIEW DR
WYLIE TX 75098-6001
WYLIE TX 75098-6001
1745 SPINNAKER WAY
WYLIE TX 75098-7988
WYLIE TX 75098-7988
204 STONE RD
WYLIE TX 75098-4103
WYLIE TX 75098-4103
Map
Hover over the map to see the ZIP code
Census data for WYLIE, TX
Demographic and housing estimates in WYLIE, TX
| Total population | 49,248 |
| Male | 24,225 |
| Female | 25,023 |
| Total population | 49,248 |
| Under 5 years | 4,108 |
| 5 to 9 years | 4,177 |
| 10 to 14 years | 4,811 |
| 15 to 19 years | 4,045 |
| 20 to 24 years | 2,445 |
| 25 to 34 years | 6,739 |
| 35 to 44 years | 8,461 |
| 45 to 54 years | 7,162 |
| 55 to 59 years | 2,429 |
| 60 to 64 years | 1,495 |
| 65 to 74 years | 2,368 |
| 75 to 84 years | 766 |
| 85 years and over | 242 |
| Median age (years) | 33.2 |
| Under 18 years | 15,902 |
| 16 years and over | 35,461 |
| 18 years and over | 33,346 |
| 21 years and over | 31,513 |
| 62 years and over | 4,071 |
| 65 years and over | 3,376 |
| Total population | 49,248 |
| One race | 47,369 |
| White | 35,772 |
| Black or African American | 6,095 |
| American Indian and Alaska Native | 174 |
| Asian | 3,546 |
| Native Hawaiian and Other Pacific Islander | 0 |
| Some other race | 1,782 |
| Two or more races | 1,879 |
| Citizen, VOTING AGE 18 and over population | 29,993 |
| Male Citizen, VOTING AGE 18 and over population | 14,716 |
| Female Citizen, VOTING AGE 18 and over population | 15,277 |
Social characteristics in WYLIE, TX
| Total households | 14,842 |
| Family households (families) | 12,175 |
| Married-couple family | 9,756 |
| Male householder, no wife present, family | 543 |
| Female householder, no husband present, family | 1,876 |
| Nonfamily households | 2,667 |
| Average household size | 3.31 |
| Average family size | 3.66 |
Economic characteristics in WYLIE, TX
| Total households | 14,842 |
| Less than $10,000 | 84 |
| $10,000 to $14,999 | 286 |
| $15,000 to $24,999 | 712 |
| $25,000 to $34,999 | 571 |
| $35,000 to $49,999 | 1,395 |
| $50,000 to $74,999 | 2,659 |
| $75,000 to $99,999 | 2,289 |
| $100,000 to $149,999 | 4,242 |
| $150,000 to $199,999 | 1,751 |
| $200,000 or more | 853 |
| Median household income (dollars) | 93,637 |
Housing characteristics in WYLIE, TX
| Total housing units | 15,343 |
| Occupied housing units | 14,842 |
| Vacant housing units | 501 |
| Total housing units | 15,343 |
| 1-unit, detached | 12,634 |
| 1-unit, attached | 379 |
| 2 units | 104 |
| 3 or 4 units | 184 |
| 5 to 9 units | 222 |
| 10 to 19 units | 261 |
| 20 or more units | 414 |
| Mobile home | 1,128 |
| Boat, RV, van, etc. | 17 |
| Total housing units | 15,343 |
| Built 2014 or later | 932 |
| Built 2010 to 2013 | 1,125 |
| Built 2000 to 2009 | 7,956 |
| Built 1990 to 1999 | 2,327 |
| Built 1980 to 1989 | 1,688 |
| Built 1970 to 1979 | 561 |
| Built 1960 to 1969 | 355 |
| Built 1950 to 1959 | 279 |
| Built 1940 to 1949 | 94 |
| Built 1939 or earlier | 26 |
| Total housing units | 15,343 |
| 1 room | 123 |
| 2 rooms | 17 |
| 3 rooms | 493 |
| 4 rooms | 1,256 |
| 5 rooms | 2,660 |
| 6 rooms | 3,125 |
| 7 rooms | 2,623 |
| 8 rooms | 1,773 |
| 9 rooms or more | 3,273 |
| Median rooms | 6.5 |
| Total housing units | 15,343 |
| No bedroom | 151 |
| 1 bedroom | 471 |
| 2 bedrooms | 1,330 |
| 3 bedrooms | 7,284 |
| 4 bedrooms | 5,154 |
| 5 or more bedrooms | 953 |
| Occupied housing units | 14,842 |
| Owner-occupied | 11,588 |
| Renter-occupied | 3,254 |
| Average household size of owner-occupied unit | 3.35 |
| Average household size of renter-occupied unit | 3.15 |
| Occupied housing units | 14,842 |
| Moved in 2017 or later | 787 |
| Moved in 2015 to 2016 | 2,236 |
| Moved in 2010 to 2014 | 4,492 |
| Moved in 2000 to 2009 | 5,884 |
| Moved in 1990 to 1999 | 985 |
| Moved in 1989 and earlier | 458 |
| Owner-occupied units | 11,588 |
| Less than $50,000 | 985 |
| $50,000 to $99,999 | 314 |
| $100,000 to $149,999 | 1,594 |
| $150,000 to $199,999 | 2,858 |
| $200,000 to $299,999 | 3,820 |
| $300,000 to $499,999 | 1,930 |
| $500,000 to $999,999 | 87 |
| $1,000,000 or more | 0 |
| Median (dollars) | 201,000 |
| Owner-occupied units | 11,588 |
| Housing units with a mortgage | 9,131 |
| Housing units without a mortgage | 2,457 |
| Occupied units paying rent | 3,212 |
| Less than $500 | 0 |
| $500 to $999 | 487 |
| $1,000 to $1,499 | 1,296 |
| $1,500 to $1,999 | 1,057 |
| $2,000 to $2,499 | 372 |
| $2,500 to $2,999 | 0 |
| $3,000 or more | 0 |
| Median (dollars) | 1,436 |
| No rent paid | 42 |
Data is based on 2018 Census
ZIP Codes for other locations
State for WYLIE
Texas ZIP CodesOther cities in Texas