MORONI, UT ZIP Code
| City | MORONI |
| State | Utah |
| ZIP Codes count | 1 (see all) |
| Post offices count | 1 (see all) |
| Total population | 1,651 (see all) |
ZIP Code in MORONI, Utah
84646
This list contains only 5-digit ZIP codes. Use our zip code lookup by address feature to get the full 9-digit (ZIP+4) code.
List of MORONI, UT ZIP Codes
| ZIP | TYPE | POPU |
|---|---|---|
| 84646 | PO BOX | 1,559 |
Post offices
MORONI — Post Office™ 46 N 400 E MORONI, UT 84646-8001 |
Envelope example
On the bottom center of the envelope, write the address you want your letter delivered to. Include the following on separate lines:
- Recipient's full name
- Full street address
- City, State, and ZIP Code
Using the same format, write the return address in the top left corner.
Using the full ZIP+4 Code when mailing via the USPS ensures the fastest, most accurate mailing possible. If you are not sure of the full 9-digit ZIP Code, use the 5-digit ZIP Code to avoid loss of letter or package.
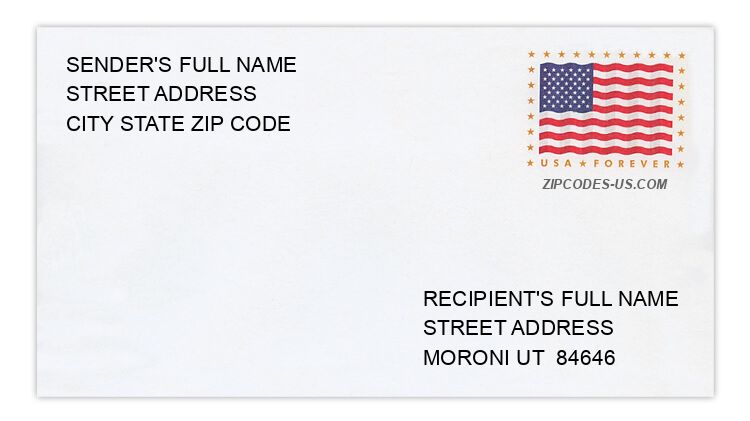
The recipient address information is provided for your reference.
Address example
1130 E 20500 N
MORONI UT 84646-7728
MORONI UT 84646-7728
305 N 200 E
MORONI UT 84646-7663
MORONI UT 84646-7663
239 N 260 W
MORONI UT 84646-7637
MORONI UT 84646-7637
18641 N 650 W
MORONI UT 84646-7784
MORONI UT 84646-7784
20496 N HIGHWAY 132
MORONI UT 84646-7610
MORONI UT 84646-7610
312 S 300 W
MORONI UT 84646-7646
MORONI UT 84646-7646
Map
Hover over the map to see the ZIP code
Census data for MORONI, UT
Demographic and housing estimates in MORONI, UT
| Total population | 1,651 |
| Male | 735 |
| Female | 916 |
| Total population | 1,651 |
| Under 5 years | 150 |
| 5 to 9 years | 137 |
| 10 to 14 years | 189 |
| 15 to 19 years | 134 |
| 20 to 24 years | 88 |
| 25 to 34 years | 201 |
| 35 to 44 years | 245 |
| 45 to 54 years | 135 |
| 55 to 59 years | 89 |
| 60 to 64 years | 86 |
| 65 to 74 years | 170 |
| 75 to 84 years | 27 |
| 85 years and over | 0 |
| Median age (years) | 32.1 |
| Under 18 years | 578 |
| 16 years and over | 1,127 |
| 18 years and over | 1,073 |
| 21 years and over | 1,014 |
| 62 years and over | 236 |
| 65 years and over | 197 |
| Total population | 1,651 |
| One race | 1,636 |
| White | 1,250 |
| Black or African American | 1 |
| American Indian and Alaska Native | 0 |
| Asian | 13 |
| Native Hawaiian and Other Pacific Islander | 0 |
| Some other race | 372 |
| Two or more races | 15 |
| Citizen, VOTING AGE 18 and over population | 974 |
| Male Citizen, VOTING AGE 18 and over population | 452 |
| Female Citizen, VOTING AGE 18 and over population | 522 |
Social characteristics in MORONI, UT
| Total households | 483 |
| Family households (families) | 432 |
| Married-couple family | 403 |
| Male householder, no wife present, family | 13 |
| Female householder, no husband present, family | 16 |
| Nonfamily households | 51 |
| Average household size | 3.42 |
| Average family size | 3.67 |
Economic characteristics in MORONI, UT
| Total households | 483 |
| Less than $10,000 | 13 |
| $10,000 to $14,999 | 12 |
| $15,000 to $24,999 | 25 |
| $25,000 to $34,999 | 50 |
| $35,000 to $49,999 | 72 |
| $50,000 to $74,999 | 155 |
| $75,000 to $99,999 | 40 |
| $100,000 to $149,999 | 76 |
| $150,000 to $199,999 | 17 |
| $200,000 or more | 23 |
| Median household income (dollars) | 61,750 |
Housing characteristics in MORONI, UT
| Total housing units | 521 |
| Occupied housing units | 483 |
| Vacant housing units | 38 |
| Total housing units | 521 |
| 1-unit, detached | 463 |
| 1-unit, attached | 15 |
| 2 units | 0 |
| 3 or 4 units | 0 |
| 5 to 9 units | 0 |
| 10 to 19 units | 16 |
| 20 or more units | 0 |
| Mobile home | 27 |
| Boat, RV, van, etc. | 0 |
| Total housing units | 521 |
| Built 2014 or later | 0 |
| Built 2010 to 2013 | 0 |
| Built 2000 to 2009 | 62 |
| Built 1990 to 1999 | 52 |
| Built 1980 to 1989 | 56 |
| Built 1970 to 1979 | 60 |
| Built 1960 to 1969 | 30 |
| Built 1950 to 1959 | 54 |
| Built 1940 to 1949 | 65 |
| Built 1939 or earlier | 142 |
| Total housing units | 521 |
| 1 room | 0 |
| 2 rooms | 10 |
| 3 rooms | 40 |
| 4 rooms | 85 |
| 5 rooms | 78 |
| 6 rooms | 70 |
| 7 rooms | 33 |
| 8 rooms | 75 |
| 9 rooms or more | 130 |
| Median rooms | 6.2 |
| Total housing units | 521 |
| No bedroom | 0 |
| 1 bedroom | 41 |
| 2 bedrooms | 110 |
| 3 bedrooms | 152 |
| 4 bedrooms | 111 |
| 5 or more bedrooms | 107 |
| Occupied housing units | 483 |
| Owner-occupied | 408 |
| Renter-occupied | 75 |
| Average household size of owner-occupied unit | 3.56 |
| Average household size of renter-occupied unit | 2.64 |
| Occupied housing units | 483 |
| Moved in 2017 or later | 19 |
| Moved in 2015 to 2016 | 33 |
| Moved in 2010 to 2014 | 103 |
| Moved in 2000 to 2009 | 155 |
| Moved in 1990 to 1999 | 102 |
| Moved in 1989 and earlier | 71 |
| Owner-occupied units | 408 |
| Less than $50,000 | 26 |
| $50,000 to $99,999 | 87 |
| $100,000 to $149,999 | 84 |
| $150,000 to $199,999 | 111 |
| $200,000 to $299,999 | 88 |
| $300,000 to $499,999 | 12 |
| $500,000 to $999,999 | 0 |
| $1,000,000 or more | 0 |
| Median (dollars) | 153,900 |
| Owner-occupied units | 408 |
| Housing units with a mortgage | 280 |
| Housing units without a mortgage | 128 |
| Occupied units paying rent | 72 |
| Less than $500 | 6 |
| $500 to $999 | 53 |
| $1,000 to $1,499 | 13 |
| $1,500 to $1,999 | 0 |
| $2,000 to $2,499 | 0 |
| $2,500 to $2,999 | 0 |
| $3,000 or more | 0 |
| Median (dollars) | 726 |
| No rent paid | 3 |
Data is based on 2018 Census
ZIP Codes for other locations
State for MORONI
Utah ZIP CodesOther cities in Utah