MANASSAS, VA ZIP Code
| City | MANASSAS |
| State | Virginia |
| ZIP Codes count | 6 (see all) |
| Post offices count | 3 (see all) |
| Total population | 41,457 (see all) |
ZIP Codes in MANASSAS, Virginia
The ZIP Codes in MANASSAS, Virginia fall within the range from 20108 to 20113. MANASSAS is covered by 6 ZIP Codes: 4 Standard and 2 PO Box. Below is the complete list:
20108, 20109, 20110, 20111, 20112, 20113
This list contains only 5-digit ZIP codes. Use our zip code lookup by address feature to get the full 9-digit (ZIP+4) code.
List of MANASSAS, VA ZIP Codes
| ZIP | TYPE | POPU |
|---|---|---|
| 20108 | PO BOX | – |
| 20109 | STANDARD | 44,512 |
| 20110 | STANDARD | 49,993 |
| 20111 | STANDARD | 36,331 |
| 20112 | STANDARD | 27,677 |
| 20113 | PO BOX | – |
Post offices
DOWNTOWN MANASSAS — Post Office™ 9108 CHURCH ST MANASSAS, VA 20110-9997 |
MANASSAS — Post Office™ 8801 SUDLEY RD MANASSAS, VA 20110-9998 |
MANASSAS PARK — Post Office™ 2049 OLD CENTREVILLE RD MANASSAS PARK, VA 20111-9998 |
Envelope example
On the bottom center of the envelope, write the address you want your letter delivered to. Include the following on separate lines:
- Recipient's full name
- Full street address
- City, State, and ZIP Code
Using the same format, write the return address in the top left corner.
Using the full ZIP+4 Code when mailing via the USPS ensures the fastest, most accurate mailing possible. If you are not sure of the full 9-digit ZIP Code, use the 5-digit ZIP Code to avoid loss of letter or package.
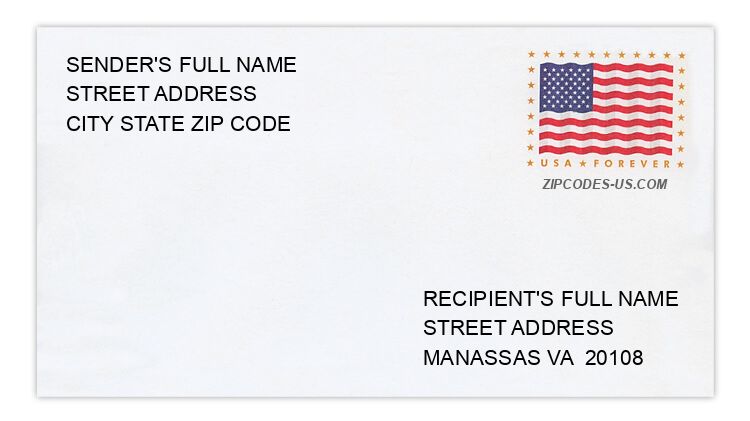
The recipient address information is provided for your reference.
Address example
8851 CHERRY OAK CT
MANASSAS VA 20109-3706
MANASSAS VA 20109-3706
9074 CONNOR HOUSE RD
MANASSAS VA 20111-7065
MANASSAS VA 20111-7065
8140 ERIKA DR
MANASSAS VA 20112-3736
MANASSAS VA 20112-3736
8377 IVY GLEN CT
MANASSAS VA 20110-4631
MANASSAS VA 20110-4631
9433 LOMAX FOREST DR
MANASSAS VA 20112-4448
MANASSAS VA 20112-4448
10184 SHILOH CT
MANASSAS VA 20109-3522
MANASSAS VA 20109-3522
Map
Hover over the map to see the ZIP code
Census data for MANASSAS, VA
Demographic and housing estimates in MANASSAS, VA
| Total population | 41,457 |
| Male | 20,775 |
| Female | 20,682 |
| Total population | 41,457 |
| Under 5 years | 3,498 |
| 5 to 9 years | 3,293 |
| 10 to 14 years | 2,729 |
| 15 to 19 years | 2,597 |
| 20 to 24 years | 2,842 |
| 25 to 34 years | 6,489 |
| 35 to 44 years | 5,949 |
| 45 to 54 years | 5,501 |
| 55 to 59 years | 2,597 |
| 60 to 64 years | 2,166 |
| 65 to 74 years | 2,486 |
| 75 to 84 years | 961 |
| 85 years and over | 349 |
| Median age (years) | 33.7 |
| Under 18 years | 11,164 |
| 16 years and over | 31,506 |
| 18 years and over | 30,293 |
| 21 years and over | 28,641 |
| 62 years and over | 5,058 |
| 65 years and over | 3,796 |
| Total population | 41,457 |
| One race | 39,500 |
| White | 27,484 |
| Black or African American | 5,758 |
| American Indian and Alaska Native | 283 |
| Asian | 2,265 |
| Native Hawaiian and Other Pacific Islander | 84 |
| Some other race | 3,626 |
| Two or more races | 1,957 |
| Citizen, VOTING AGE 18 and over population | 24,206 |
| Male Citizen, VOTING AGE 18 and over population | 11,980 |
| Female Citizen, VOTING AGE 18 and over population | 12,226 |
Social characteristics in MANASSAS, VA
| Total households | 12,749 |
| Family households (families) | 9,473 |
| Married-couple family | 7,429 |
| Male householder, no wife present, family | 543 |
| Female householder, no husband present, family | 1,501 |
| Nonfamily households | 3,276 |
| Average household size | 3.25 |
| Average family size | 3.78 |
Economic characteristics in MANASSAS, VA
| Total households | 12,749 |
| Less than $10,000 | 582 |
| $10,000 to $14,999 | 183 |
| $15,000 to $24,999 | 674 |
| $25,000 to $34,999 | 844 |
| $35,000 to $49,999 | 1,439 |
| $50,000 to $74,999 | 2,415 |
| $75,000 to $99,999 | 2,063 |
| $100,000 to $149,999 | 2,446 |
| $150,000 to $199,999 | 1,188 |
| $200,000 or more | 915 |
| Median household income (dollars) | 78,462 |
Housing characteristics in MANASSAS, VA
| Total housing units | 13,583 |
| Occupied housing units | 12,749 |
| Vacant housing units | 834 |
| Total housing units | 13,583 |
| 1-unit, detached | 5,750 |
| 1-unit, attached | 3,715 |
| 2 units | 230 |
| 3 or 4 units | 442 |
| 5 to 9 units | 829 |
| 10 to 19 units | 1,727 |
| 20 or more units | 752 |
| Mobile home | 138 |
| Boat, RV, van, etc. | 0 |
| Total housing units | 13,583 |
| Built 2014 or later | 101 |
| Built 2010 to 2013 | 477 |
| Built 2000 to 2009 | 1,293 |
| Built 1990 to 1999 | 2,370 |
| Built 1980 to 1989 | 4,342 |
| Built 1970 to 1979 | 2,510 |
| Built 1960 to 1969 | 1,393 |
| Built 1950 to 1959 | 343 |
| Built 1940 to 1949 | 308 |
| Built 1939 or earlier | 446 |
| Total housing units | 13,583 |
| 1 room | 209 |
| 2 rooms | 272 |
| 3 rooms | 869 |
| 4 rooms | 2,026 |
| 5 rooms | 2,010 |
| 6 rooms | 2,180 |
| 7 rooms | 1,731 |
| 8 rooms | 1,541 |
| 9 rooms or more | 2,745 |
| Median rooms | 6.1 |
| Total housing units | 13,583 |
| No bedroom | 232 |
| 1 bedroom | 1,137 |
| 2 bedrooms | 2,854 |
| 3 bedrooms | 5,261 |
| 4 bedrooms | 3,160 |
| 5 or more bedrooms | 939 |
| Occupied housing units | 12,749 |
| Owner-occupied | 8,301 |
| Renter-occupied | 4,448 |
| Average household size of owner-occupied unit | 3.25 |
| Average household size of renter-occupied unit | 3.23 |
| Occupied housing units | 12,749 |
| Moved in 2017 or later | 669 |
| Moved in 2015 to 2016 | 1,757 |
| Moved in 2010 to 2014 | 3,909 |
| Moved in 2000 to 2009 | 3,510 |
| Moved in 1990 to 1999 | 1,567 |
| Moved in 1989 and earlier | 1,337 |
| Owner-occupied units | 8,301 |
| Less than $50,000 | 137 |
| $50,000 to $99,999 | 60 |
| $100,000 to $149,999 | 333 |
| $150,000 to $199,999 | 698 |
| $200,000 to $299,999 | 2,569 |
| $300,000 to $499,999 | 4,086 |
| $500,000 to $999,999 | 413 |
| $1,000,000 or more | 5 |
| Median (dollars) | 313,100 |
| Owner-occupied units | 8,301 |
| Housing units with a mortgage | 6,720 |
| Housing units without a mortgage | 1,581 |
| Occupied units paying rent | 4,393 |
| Less than $500 | 73 |
| $500 to $999 | 472 |
| $1,000 to $1,499 | 1,799 |
| $1,500 to $1,999 | 1,530 |
| $2,000 to $2,499 | 388 |
| $2,500 to $2,999 | 42 |
| $3,000 or more | 89 |
| Median (dollars) | 1,467 |
| No rent paid | 55 |
Data is based on 2018 Census
ZIP Codes for other locations
State for MANASSAS
Virginia ZIP CodesOther cities in Virginia