NORFORK, AR ZIP Code
| City | NORFORK |
| State | Arkansas |
| ZIP Codes count | 2 (see all) |
| Post offices count | 1 (see all) |
| Total population | 585 (see all) |
ZIP Codes in NORFORK, Arkansas
72658, 72659
This list contains only 5-digit ZIP codes. Use our zip code lookup by address feature to get the full 9-digit (ZIP+4) code.
List of NORFORK, AR ZIP Codes
| ZIP | TYPE | POPU |
|---|---|---|
| 72658 | STANDARD | 1,276 |
| 72659 | STANDARD | – |
Post offices
NORFORK — Post Office™ 13862 HIGHWAY 5 S NORFORK, AR 72658-9998 |
Envelope example
On the bottom center of the envelope, write the address you want your letter delivered to. Include the following on separate lines:
- Recipient's full name
- Full street address
- City, State, and ZIP Code
Using the same format, write the return address in the top left corner.
Using the full ZIP+4 Code when mailing via the USPS ensures the fastest, most accurate mailing possible. If you are not sure of the full 9-digit ZIP Code, use the 5-digit ZIP Code to avoid loss of letter or package.
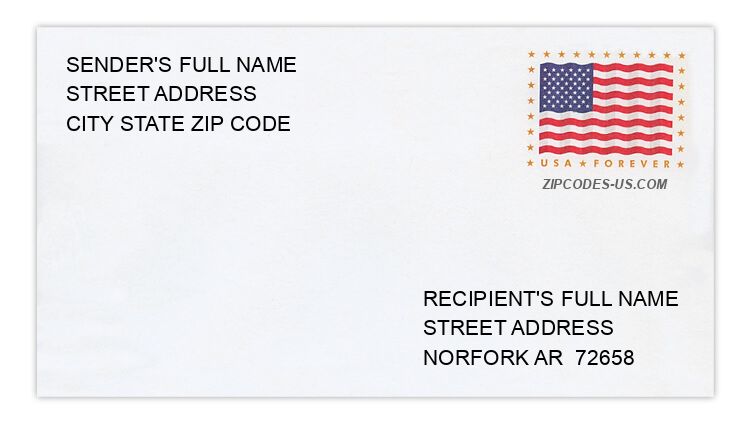
The recipient address information is provided for your reference.
Address example
192 COUNTY ROAD 1072
NORFORK AR 72658-8010
NORFORK AR 72658-8010
399 HAVNER LN
NORFORK AR 72658-8308
NORFORK AR 72658-8308
154 MILDRED SIMPSON DR
NORFORK AR 72658-8415
NORFORK AR 72658-8415
385 OLD FARM PL
NORFORK AR 72658-9602
NORFORK AR 72658-9602
234 TALLYE TRL
NORFORK AR 72658-9137
NORFORK AR 72658-9137
639 TEEGARDEN LN
NORFORK AR 72658-8519
NORFORK AR 72658-8519
Map
Hover over the map to see the ZIP code
Census data for NORFORK, AR
Demographic and housing estimates in NORFORK, AR
| Total population | 585 |
| Male | 315 |
| Female | 270 |
| Total population | 585 |
| Under 5 years | 53 |
| 5 to 9 years | 47 |
| 10 to 14 years | 23 |
| 15 to 19 years | 18 |
| 20 to 24 years | 23 |
| 25 to 34 years | 80 |
| 35 to 44 years | 58 |
| 45 to 54 years | 90 |
| 55 to 59 years | 37 |
| 60 to 64 years | 55 |
| 65 to 74 years | 72 |
| 75 to 84 years | 27 |
| 85 years and over | 2 |
| Median age (years) | 44.1 |
| Under 18 years | 137 |
| 16 years and over | 459 |
| 18 years and over | 448 |
| 21 years and over | 444 |
| 62 years and over | 128 |
| 65 years and over | 101 |
| Total population | 585 |
| One race | 569 |
| White | 567 |
| Black or African American | 0 |
| American Indian and Alaska Native | 1 |
| Asian | 1 |
| Native Hawaiian and Other Pacific Islander | 0 |
| Some other race | 0 |
| Two or more races | 16 |
| Citizen, VOTING AGE 18 and over population | 448 |
| Male Citizen, VOTING AGE 18 and over population | 244 |
| Female Citizen, VOTING AGE 18 and over population | 204 |
Social characteristics in NORFORK, AR
| Total households | 228 |
| Family households (families) | 143 |
| Married-couple family | 106 |
| Male householder, no wife present, family | 15 |
| Female householder, no husband present, family | 22 |
| Nonfamily households | 85 |
| Average household size | 2.57 |
| Average family size | 3.35 |
Economic characteristics in NORFORK, AR
| Total households | 228 |
| Less than $10,000 | 20 |
| $10,000 to $14,999 | 9 |
| $15,000 to $24,999 | 46 |
| $25,000 to $34,999 | 39 |
| $35,000 to $49,999 | 43 |
| $50,000 to $74,999 | 33 |
| $75,000 to $99,999 | 17 |
| $100,000 to $149,999 | 14 |
| $150,000 to $199,999 | 5 |
| $200,000 or more | 2 |
| Median household income (dollars) | 35,000 |
Housing characteristics in NORFORK, AR
| Total housing units | 365 |
| Occupied housing units | 228 |
| Vacant housing units | 137 |
| Total housing units | 365 |
| 1-unit, detached | 285 |
| 1-unit, attached | 0 |
| 2 units | 0 |
| 3 or 4 units | 15 |
| 5 to 9 units | 14 |
| 10 to 19 units | 0 |
| 20 or more units | 3 |
| Mobile home | 48 |
| Boat, RV, van, etc. | 0 |
| Total housing units | 365 |
| Built 2014 or later | 2 |
| Built 2010 to 2013 | 17 |
| Built 2000 to 2009 | 79 |
| Built 1990 to 1999 | 102 |
| Built 1980 to 1989 | 66 |
| Built 1970 to 1979 | 61 |
| Built 1960 to 1969 | 21 |
| Built 1950 to 1959 | 0 |
| Built 1940 to 1949 | 11 |
| Built 1939 or earlier | 6 |
| Total housing units | 365 |
| 1 room | 19 |
| 2 rooms | 5 |
| 3 rooms | 25 |
| 4 rooms | 32 |
| 5 rooms | 127 |
| 6 rooms | 73 |
| 7 rooms | 41 |
| 8 rooms | 20 |
| 9 rooms or more | 23 |
| Median rooms | 5.3 |
| Total housing units | 365 |
| No bedroom | 19 |
| 1 bedroom | 11 |
| 2 bedrooms | 84 |
| 3 bedrooms | 201 |
| 4 bedrooms | 50 |
| 5 or more bedrooms | 0 |
| Occupied housing units | 228 |
| Owner-occupied | 145 |
| Renter-occupied | 83 |
| Average household size of owner-occupied unit | 2.57 |
| Average household size of renter-occupied unit | 2.57 |
| Occupied housing units | 228 |
| Moved in 2017 or later | 8 |
| Moved in 2015 to 2016 | 56 |
| Moved in 2010 to 2014 | 61 |
| Moved in 2000 to 2009 | 58 |
| Moved in 1990 to 1999 | 21 |
| Moved in 1989 and earlier | 24 |
| Owner-occupied units | 145 |
| Less than $50,000 | 9 |
| $50,000 to $99,999 | 30 |
| $100,000 to $149,999 | 31 |
| $150,000 to $199,999 | 27 |
| $200,000 to $299,999 | 22 |
| $300,000 to $499,999 | 22 |
| $500,000 to $999,999 | 4 |
| $1,000,000 or more | 0 |
| Median (dollars) | 152,800 |
| Owner-occupied units | 145 |
| Housing units with a mortgage | 54 |
| Housing units without a mortgage | 91 |
| Occupied units paying rent | 72 |
| Less than $500 | 29 |
| $500 to $999 | 43 |
| $1,000 to $1,499 | 0 |
| $1,500 to $1,999 | 0 |
| $2,000 to $2,499 | 0 |
| $2,500 to $2,999 | 0 |
| $3,000 or more | 0 |
| Median (dollars) | 609 |
| No rent paid | 11 |
Data is based on 2018 Census
ZIP Codes for other locations
State for NORFORK
Arkansas ZIP CodesOther cities in Arkansas