BISBEE, AZ ZIP Code
| City | BISBEE |
| State | Arizona |
| ZIP Codes count | 1 (see all) |
| Post offices count | 2 (see all) |
| Total population | 5,231 (see all) |
ZIP Code in BISBEE, Arizona
85603
This list contains only 5-digit ZIP codes. Use our zip code lookup by address feature to get the full 9-digit (ZIP+4) code.
List of BISBEE, AZ ZIP Codes
| ZIP | TYPE | POPU |
|---|---|---|
| 85603 | STANDARD | 6,587 |
Post offices
BISBEE — Post Office™ 1248 W HIGHWAY 92 BISBEE, AZ 85603-9998 |
COPPER QUEEN — Post Office™ 6 MAIN ST BISBEE, AZ 85603-9901 |
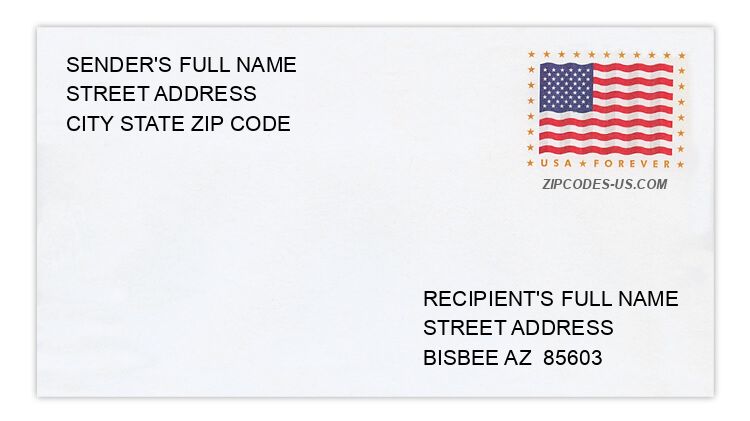
Envelope example
On the bottom center of the envelope, write the address you want your letter delivered to. Include the following on separate lines:
- Recipient's full name
- Full street address
- City, State, and ZIP Code
Using the same format, write the return address in the top left corner.
Using the full ZIP+4 Code when mailing via the USPS ensures the fastest, most accurate mailing possible. If you are not sure of the full 9-digit ZIP Code, use the 5-digit ZIP Code to avoid loss of letter or package.
The recipient address information is provided for your reference.
Address example
25 HILLCREST DR
BISBEE AZ 85603-1249
BISBEE AZ 85603-1249
34 MASON ADDITION ST
BISBEE AZ 85603-1133
BISBEE AZ 85603-1133
168 MOHAVE DR
BISBEE AZ 85603-9752
BISBEE AZ 85603-9752
1629 S AVENUE Q
BISBEE AZ 85603-9000
BISBEE AZ 85603-9000
1811 S DARK MOON LN
BISBEE AZ 85603-9065
BISBEE AZ 85603-9065
133 S WELLER LN
BISBEE AZ 85603-9050
BISBEE AZ 85603-9050
Map
Hover over the map to see the ZIP code
Census data for BISBEE, AZ
Demographic and housing estimates in BISBEE, AZ
| Total population | 5,231 |
| Male | 2,504 |
| Female | 2,727 |
| Total population | 5,231 |
| Under 5 years | 118 |
| 5 to 9 years | 408 |
| 10 to 14 years | 363 |
| 15 to 19 years | 199 |
| 20 to 24 years | 231 |
| 25 to 34 years | 497 |
| 35 to 44 years | 368 |
| 45 to 54 years | 648 |
| 55 to 59 years | 320 |
| 60 to 64 years | 407 |
| 65 to 74 years | 960 |
| 75 to 84 years | 473 |
| 85 years and over | 239 |
| Median age (years) | 50.8 |
| Under 18 years | 1,052 |
| 16 years and over | 4,328 |
| 18 years and over | 4,179 |
| 21 years and over | 4,104 |
| 62 years and over | 1,836 |
| 65 years and over | 1,672 |
| Total population | 5,231 |
| One race | 5,137 |
| White | 4,574 |
| Black or African American | 53 |
| American Indian and Alaska Native | 70 |
| Asian | 0 |
| Native Hawaiian and Other Pacific Islander | 0 |
| Some other race | 440 |
| Two or more races | 94 |
| Citizen, VOTING AGE 18 and over population | 3,977 |
| Male Citizen, VOTING AGE 18 and over population | 1,920 |
| Female Citizen, VOTING AGE 18 and over population | 2,057 |
Social characteristics in BISBEE, AZ
| Total households | 2,520 |
| Family households (families) | 1,195 |
| Married-couple family | 751 |
| Male householder, no wife present, family | 122 |
| Female householder, no husband present, family | 322 |
| Nonfamily households | 1,325 |
| Average household size | 1.96 |
| Average family size | 2.82 |
Economic characteristics in BISBEE, AZ
| Total households | 2,520 |
| Less than $10,000 | 249 |
| $10,000 to $14,999 | 262 |
| $15,000 to $24,999 | 500 |
| $25,000 to $34,999 | 322 |
| $35,000 to $49,999 | 384 |
| $50,000 to $74,999 | 350 |
| $75,000 to $99,999 | 167 |
| $100,000 to $149,999 | 242 |
| $150,000 to $199,999 | 38 |
| $200,000 or more | 6 |
| Median household income (dollars) | 32,500 |
Housing characteristics in BISBEE, AZ
| Total housing units | 3,545 |
| Occupied housing units | 2,520 |
| Vacant housing units | 1,025 |
| Total housing units | 3,545 |
| 1-unit, detached | 2,947 |
| 1-unit, attached | 119 |
| 2 units | 52 |
| 3 or 4 units | 77 |
| 5 to 9 units | 75 |
| 10 to 19 units | 6 |
| 20 or more units | 164 |
| Mobile home | 105 |
| Boat, RV, van, etc. | 0 |
| Total housing units | 3,545 |
| Built 2014 or later | 0 |
| Built 2010 to 2013 | 0 |
| Built 2000 to 2009 | 177 |
| Built 1990 to 1999 | 112 |
| Built 1980 to 1989 | 48 |
| Built 1970 to 1979 | 172 |
| Built 1960 to 1969 | 193 |
| Built 1950 to 1959 | 636 |
| Built 1940 to 1949 | 260 |
| Built 1939 or earlier | 1,947 |
| Total housing units | 3,545 |
| 1 room | 123 |
| 2 rooms | 54 |
| 3 rooms | 249 |
| 4 rooms | 738 |
| 5 rooms | 1,026 |
| 6 rooms | 702 |
| 7 rooms | 354 |
| 8 rooms | 128 |
| 9 rooms or more | 171 |
| Median rooms | 5.1 |
| Total housing units | 3,545 |
| No bedroom | 123 |
| 1 bedroom | 470 |
| 2 bedrooms | 1,291 |
| 3 bedrooms | 1,349 |
| 4 bedrooms | 272 |
| 5 or more bedrooms | 40 |
| Occupied housing units | 2,520 |
| Owner-occupied | 1,755 |
| Renter-occupied | 765 |
| Average household size of owner-occupied unit | 1.97 |
| Average household size of renter-occupied unit | 1.93 |
| Occupied housing units | 2,520 |
| Moved in 2017 or later | 139 |
| Moved in 2015 to 2016 | 204 |
| Moved in 2010 to 2014 | 791 |
| Moved in 2000 to 2009 | 577 |
| Moved in 1990 to 1999 | 333 |
| Moved in 1989 and earlier | 476 |
| Owner-occupied units | 1,755 |
| Less than $50,000 | 114 |
| $50,000 to $99,999 | 454 |
| $100,000 to $149,999 | 492 |
| $150,000 to $199,999 | 339 |
| $200,000 to $299,999 | 279 |
| $300,000 to $499,999 | 77 |
| $500,000 to $999,999 | 0 |
| $1,000,000 or more | 0 |
| Median (dollars) | 125,700 |
| Owner-occupied units | 1,755 |
| Housing units with a mortgage | 942 |
| Housing units without a mortgage | 813 |
| Occupied units paying rent | 710 |
| Less than $500 | 230 |
| $500 to $999 | 415 |
| $1,000 to $1,499 | 65 |
| $1,500 to $1,999 | 0 |
| $2,000 to $2,499 | 0 |
| $2,500 to $2,999 | 0 |
| $3,000 or more | 0 |
| Median (dollars) | 658 |
| No rent paid | 55 |
Data is based on 2018 Census
ZIP Codes for other locations
State for BISBEE
Arizona ZIP CodesOther cities in Arizona