PIMA, AZ ZIP Code
| City | PIMA |
| State | Arizona |
| ZIP Codes count | 1 (see all) |
| Post offices count | 1 (see all) |
| Total population | 2,507 (see all) |
ZIP Code in PIMA, Arizona
85543
This list contains only 5-digit ZIP codes. Use our zip code lookup by address feature to get the full 9-digit (ZIP+4) code.
List of PIMA, AZ ZIP Codes
| ZIP | TYPE | POPU |
|---|---|---|
| 85543 | STANDARD | 4,073 |
Post offices
PIMA — Post Office™ 41 E CENTER ST PIMA, AZ 85543-9998 |
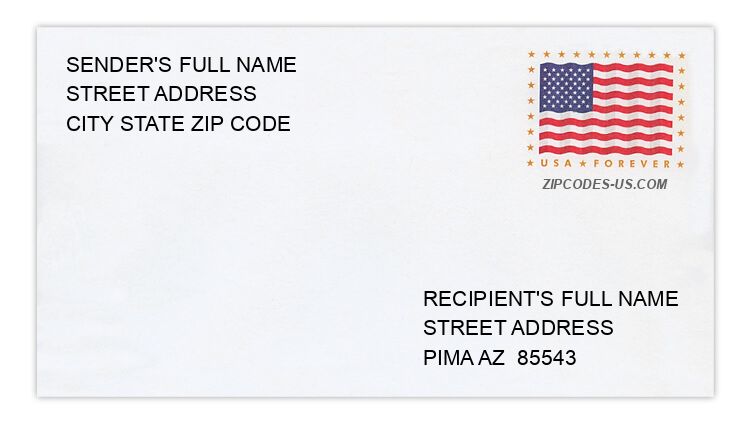
Envelope example
On the bottom center of the envelope, write the address you want your letter delivered to. Include the following on separate lines:
- Recipient's full name
- Full street address
- City, State, and ZIP Code
Using the same format, write the return address in the top left corner.
Using the full ZIP+4 Code when mailing via the USPS ensures the fastest, most accurate mailing possible. If you are not sure of the full 9-digit ZIP Code, use the 5-digit ZIP Code to avoid loss of letter or package.
The recipient address information is provided for your reference.
Address example
455 N 1200 W
PIMA AZ 85543-9659
PIMA AZ 85543-9659
1 N 700 W
PIMA AZ 85543-9578
PIMA AZ 85543-9578
7912 N DRAGON LN
PIMA AZ 85543-9621
PIMA AZ 85543-9621
1463 W 275 N
PIMA AZ 85543-9587
PIMA AZ 85543-9587
7848 W KACHINA ST
PIMA AZ 85543-9545
PIMA AZ 85543-9545
7588 W MELANIE
PIMA AZ 85543-9837
PIMA AZ 85543-9837
Map
Hover over the map to see the ZIP code
Census data for PIMA, AZ
Demographic and housing estimates in PIMA, AZ
| Total population | 2,507 |
| Male | 1,132 |
| Female | 1,375 |
| Total population | 2,507 |
| Under 5 years | 132 |
| 5 to 9 years | 225 |
| 10 to 14 years | 419 |
| 15 to 19 years | 166 |
| 20 to 24 years | 71 |
| 25 to 34 years | 361 |
| 35 to 44 years | 314 |
| 45 to 54 years | 171 |
| 55 to 59 years | 136 |
| 60 to 64 years | 198 |
| 65 to 74 years | 186 |
| 75 to 84 years | 88 |
| 85 years and over | 40 |
| Median age (years) | 30.8 |
| Under 18 years | 887 |
| 16 years and over | 1,700 |
| 18 years and over | 1,620 |
| 21 years and over | 1,543 |
| 62 years and over | 443 |
| 65 years and over | 314 |
| Total population | 2,507 |
| One race | 2,481 |
| White | 2,356 |
| Black or African American | 7 |
| American Indian and Alaska Native | 45 |
| Asian | 6 |
| Native Hawaiian and Other Pacific Islander | 10 |
| Some other race | 57 |
| Two or more races | 26 |
| Citizen, VOTING AGE 18 and over population | 1,595 |
| Male Citizen, VOTING AGE 18 and over population | 761 |
| Female Citizen, VOTING AGE 18 and over population | 834 |
Social characteristics in PIMA, AZ
| Total households | 795 |
| Family households (families) | 612 |
| Married-couple family | 439 |
| Male householder, no wife present, family | 57 |
| Female householder, no husband present, family | 116 |
| Nonfamily households | 183 |
| Average household size | 3.15 |
| Average family size | 3.67 |
Economic characteristics in PIMA, AZ
| Total households | 795 |
| Less than $10,000 | 97 |
| $10,000 to $14,999 | 35 |
| $15,000 to $24,999 | 86 |
| $25,000 to $34,999 | 93 |
| $35,000 to $49,999 | 107 |
| $50,000 to $74,999 | 132 |
| $75,000 to $99,999 | 93 |
| $100,000 to $149,999 | 137 |
| $150,000 to $199,999 | 15 |
| $200,000 or more | 0 |
| Median household income (dollars) | 43,942 |
Housing characteristics in PIMA, AZ
| Total housing units | 989 |
| Occupied housing units | 795 |
| Vacant housing units | 194 |
| Total housing units | 989 |
| 1-unit, detached | 620 |
| 1-unit, attached | 21 |
| 2 units | 9 |
| 3 or 4 units | 0 |
| 5 to 9 units | 0 |
| 10 to 19 units | 0 |
| 20 or more units | 10 |
| Mobile home | 329 |
| Boat, RV, van, etc. | 0 |
| Total housing units | 989 |
| Built 2014 or later | 4 |
| Built 2010 to 2013 | 10 |
| Built 2000 to 2009 | 162 |
| Built 1990 to 1999 | 264 |
| Built 1980 to 1989 | 139 |
| Built 1970 to 1979 | 158 |
| Built 1960 to 1969 | 84 |
| Built 1950 to 1959 | 65 |
| Built 1940 to 1949 | 46 |
| Built 1939 or earlier | 57 |
| Total housing units | 989 |
| 1 room | 19 |
| 2 rooms | 0 |
| 3 rooms | 9 |
| 4 rooms | 105 |
| 5 rooms | 273 |
| 6 rooms | 314 |
| 7 rooms | 159 |
| 8 rooms | 72 |
| 9 rooms or more | 38 |
| Median rooms | 5.8 |
| Total housing units | 989 |
| No bedroom | 19 |
| 1 bedroom | 25 |
| 2 bedrooms | 169 |
| 3 bedrooms | 572 |
| 4 bedrooms | 165 |
| 5 or more bedrooms | 39 |
| Occupied housing units | 795 |
| Owner-occupied | 620 |
| Renter-occupied | 175 |
| Average household size of owner-occupied unit | 3.06 |
| Average household size of renter-occupied unit | 3.47 |
| Occupied housing units | 795 |
| Moved in 2017 or later | 0 |
| Moved in 2015 to 2016 | 140 |
| Moved in 2010 to 2014 | 187 |
| Moved in 2000 to 2009 | 189 |
| Moved in 1990 to 1999 | 149 |
| Moved in 1989 and earlier | 130 |
| Owner-occupied units | 620 |
| Less than $50,000 | 64 |
| $50,000 to $99,999 | 180 |
| $100,000 to $149,999 | 126 |
| $150,000 to $199,999 | 106 |
| $200,000 to $299,999 | 88 |
| $300,000 to $499,999 | 43 |
| $500,000 to $999,999 | 13 |
| $1,000,000 or more | 0 |
| Median (dollars) | 117,400 |
| Owner-occupied units | 620 |
| Housing units with a mortgage | 364 |
| Housing units without a mortgage | 256 |
| Occupied units paying rent | 152 |
| Less than $500 | 18 |
| $500 to $999 | 50 |
| $1,000 to $1,499 | 72 |
| $1,500 to $1,999 | 12 |
| $2,000 to $2,499 | 0 |
| $2,500 to $2,999 | 0 |
| $3,000 or more | 0 |
| Median (dollars) | 1,091 |
| No rent paid | 23 |
Data is based on 2018 Census
ZIP Codes for other locations
State for PIMA
Arizona ZIP CodesOther cities in Arizona