MORRISON, IL ZIP Code
| City | MORRISON |
| State | Illinois |
| ZIP Codes count | 1 (see all) |
| Post offices count | 1 (see all) |
| Total population | 3,872 (see all) |
ZIP Code in MORRISON, Illinois
61270
This list contains only 5-digit ZIP codes. Use our zip code lookup by address feature to get the full 9-digit (ZIP+4) code.
List of MORRISON, IL ZIP Codes
| ZIP | TYPE | POPU |
|---|---|---|
| 61270 | STANDARD | 6,991 |
Post offices
MORRISON — Post Office™ 226 W MAIN ST MORRISON, IL 61270-9998 |
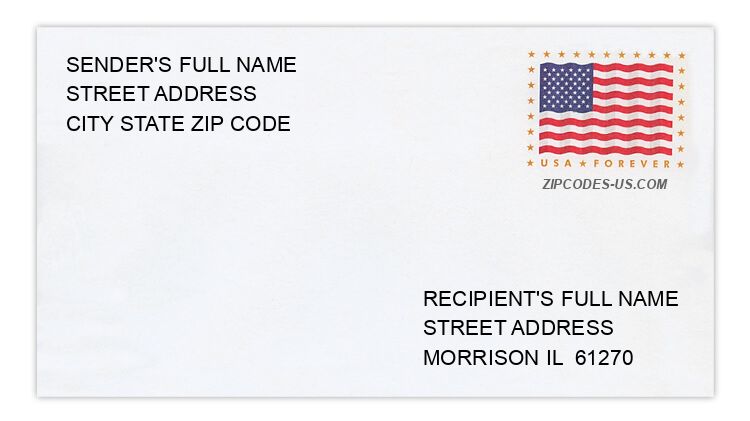
Envelope example
On the bottom center of the envelope, write the address you want your letter delivered to. Include the following on separate lines:
- Recipient's full name
- Full street address
- City, State, and ZIP Code
Using the same format, write the return address in the top left corner.
Using the full ZIP+4 Code when mailing via the USPS ensures the fastest, most accurate mailing possible. If you are not sure of the full 9-digit ZIP Code, use the 5-digit ZIP Code to avoid loss of letter or package.
The recipient address information is provided for your reference.
Address example
19834 BEACH RD
MORRISON IL 61270-9702
MORRISON IL 61270-9702
233 E MARKET ST
MORRISON IL 61270-2854
MORRISON IL 61270-2854
14140 HILLSIDE RD
MORRISON IL 61270-9650
MORRISON IL 61270-9650
468 MARKLAND DR
MORRISON IL 61270-2940
MORRISON IL 61270-2940
496 N CLINTON ST
MORRISON IL 61270-2805
MORRISON IL 61270-2805
16883 TANGLEWILD DR
MORRISON IL 61270-9798
MORRISON IL 61270-9798
Map
Hover over the map to see the ZIP code
Census data for MORRISON, IL
Demographic and housing estimates in MORRISON, IL
| Total population | 3,872 |
| Male | 1,935 |
| Female | 1,937 |
| Total population | 3,872 |
| Under 5 years | 247 |
| 5 to 9 years | 221 |
| 10 to 14 years | 234 |
| 15 to 19 years | 248 |
| 20 to 24 years | 202 |
| 25 to 34 years | 505 |
| 35 to 44 years | 438 |
| 45 to 54 years | 459 |
| 55 to 59 years | 156 |
| 60 to 64 years | 311 |
| 65 to 74 years | 399 |
| 75 to 84 years | 249 |
| 85 years and over | 203 |
| Median age (years) | 41.6 |
| Under 18 years | 829 |
| 16 years and over | 3,091 |
| 18 years and over | 3,043 |
| 21 years and over | 2,890 |
| 62 years and over | 1,012 |
| 65 years and over | 851 |
| Total population | 3,872 |
| One race | 3,812 |
| White | 3,761 |
| Black or African American | 24 |
| American Indian and Alaska Native | 0 |
| Asian | 15 |
| Native Hawaiian and Other Pacific Islander | 0 |
| Some other race | 12 |
| Two or more races | 60 |
| Citizen, VOTING AGE 18 and over population | 3,028 |
| Male Citizen, VOTING AGE 18 and over population | 1,522 |
| Female Citizen, VOTING AGE 18 and over population | 1,506 |
Social characteristics in MORRISON, IL
| Total households | 1,630 |
| Family households (families) | 972 |
| Married-couple family | 767 |
| Male householder, no wife present, family | 51 |
| Female householder, no husband present, family | 154 |
| Nonfamily households | 658 |
| Average household size | 2.21 |
| Average family size | 2.90 |
Economic characteristics in MORRISON, IL
| Total households | 1,630 |
| Less than $10,000 | 84 |
| $10,000 to $14,999 | 37 |
| $15,000 to $24,999 | 185 |
| $25,000 to $34,999 | 183 |
| $35,000 to $49,999 | 415 |
| $50,000 to $74,999 | 307 |
| $75,000 to $99,999 | 166 |
| $100,000 to $149,999 | 195 |
| $150,000 to $199,999 | 49 |
| $200,000 or more | 9 |
| Median household income (dollars) | 43,886 |
Housing characteristics in MORRISON, IL
| Total housing units | 1,821 |
| Occupied housing units | 1,630 |
| Vacant housing units | 191 |
| Total housing units | 1,821 |
| 1-unit, detached | 1,437 |
| 1-unit, attached | 52 |
| 2 units | 123 |
| 3 or 4 units | 113 |
| 5 to 9 units | 19 |
| 10 to 19 units | 9 |
| 20 or more units | 68 |
| Mobile home | 0 |
| Boat, RV, van, etc. | 0 |
| Total housing units | 1,821 |
| Built 2014 or later | 7 |
| Built 2010 to 2013 | 8 |
| Built 2000 to 2009 | 93 |
| Built 1990 to 1999 | 53 |
| Built 1980 to 1989 | 82 |
| Built 1970 to 1979 | 124 |
| Built 1960 to 1969 | 342 |
| Built 1950 to 1959 | 296 |
| Built 1940 to 1949 | 180 |
| Built 1939 or earlier | 636 |
| Total housing units | 1,821 |
| 1 room | 8 |
| 2 rooms | 49 |
| 3 rooms | 9 |
| 4 rooms | 209 |
| 5 rooms | 347 |
| 6 rooms | 467 |
| 7 rooms | 213 |
| 8 rooms | 241 |
| 9 rooms or more | 278 |
| Median rooms | 6.1 |
| Total housing units | 1,821 |
| No bedroom | 8 |
| 1 bedroom | 204 |
| 2 bedrooms | 540 |
| 3 bedrooms | 694 |
| 4 bedrooms | 334 |
| 5 or more bedrooms | 41 |
| Occupied housing units | 1,630 |
| Owner-occupied | 1,240 |
| Renter-occupied | 390 |
| Average household size of owner-occupied unit | 2.31 |
| Average household size of renter-occupied unit | 1.87 |
| Occupied housing units | 1,630 |
| Moved in 2017 or later | 45 |
| Moved in 2015 to 2016 | 201 |
| Moved in 2010 to 2014 | 454 |
| Moved in 2000 to 2009 | 374 |
| Moved in 1990 to 1999 | 232 |
| Moved in 1989 and earlier | 324 |
| Owner-occupied units | 1,240 |
| Less than $50,000 | 101 |
| $50,000 to $99,999 | 548 |
| $100,000 to $149,999 | 312 |
| $150,000 to $199,999 | 215 |
| $200,000 to $299,999 | 48 |
| $300,000 to $499,999 | 8 |
| $500,000 to $999,999 | 0 |
| $1,000,000 or more | 8 |
| Median (dollars) | 97,100 |
| Owner-occupied units | 1,240 |
| Housing units with a mortgage | 710 |
| Housing units without a mortgage | 530 |
| Occupied units paying rent | 383 |
| Less than $500 | 74 |
| $500 to $999 | 298 |
| $1,000 to $1,499 | 11 |
| $1,500 to $1,999 | 0 |
| $2,000 to $2,499 | 0 |
| $2,500 to $2,999 | 0 |
| $3,000 or more | 0 |
| Median (dollars) | 714 |
| No rent paid | 7 |
Data is based on 2018 Census
ZIP Codes for other locations
State for MORRISON
Illinois ZIP CodesOther cities in Illinois