MORTON, IL ZIP Code
| City | MORTON |
| State | Illinois |
| ZIP Codes count | 1 (see all) |
| Post offices count | 1 (see all) |
| Total population | 16,731 (see all) |
ZIP Code in MORTON, Illinois
61550
This list contains only 5-digit ZIP codes. Use our zip code lookup by address feature to get the full 9-digit (ZIP+4) code.
List of MORTON, IL ZIP Codes
| ZIP | TYPE | POPU |
|---|---|---|
| 61550 | STANDARD | 18,223 |
Post offices
MORTON — Post Office™ 600 W JEFFERSON ST MORTON, IL 61550-9998 |
Envelope example
On the bottom center of the envelope, write the address you want your letter delivered to. Include the following on separate lines:
- Recipient's full name
- Full street address
- City, State, and ZIP Code
Using the same format, write the return address in the top left corner.
Using the full ZIP+4 Code when mailing via the USPS ensures the fastest, most accurate mailing possible. If you are not sure of the full 9-digit ZIP Code, use the 5-digit ZIP Code to avoid loss of letter or package.
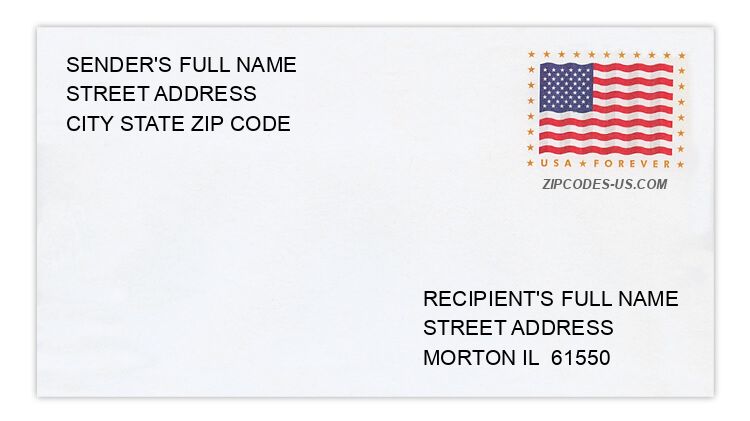
The recipient address information is provided for your reference.
Address example
1147 E MONROE ST
MORTON IL 61550-2371
MORTON IL 61550-2371
147 E OAKWOOD ST
MORTON IL 61550-2838
MORTON IL 61550-2838
933 KAY CT
MORTON IL 61550-2249
MORTON IL 61550-2249
451 SHAGGYBARK TRL
MORTON IL 61550-9552
MORTON IL 61550-9552
1094 SUMMERSET ST
MORTON IL 61550-3047
MORTON IL 61550-3047
306 W EDGEWOOD ST
MORTON IL 61550-24ND
MORTON IL 61550-24ND
Map
Hover over the map to see the ZIP code
Census data for MORTON, IL
Demographic and housing estimates in MORTON, IL
| Total population | 16,731 |
| Male | 7,999 |
| Female | 8,732 |
| Total population | 16,731 |
| Under 5 years | 949 |
| 5 to 9 years | 1,211 |
| 10 to 14 years | 1,258 |
| 15 to 19 years | 964 |
| 20 to 24 years | 719 |
| 25 to 34 years | 1,819 |
| 35 to 44 years | 1,968 |
| 45 to 54 years | 2,040 |
| 55 to 59 years | 1,164 |
| 60 to 64 years | 1,076 |
| 65 to 74 years | 1,792 |
| 75 to 84 years | 1,188 |
| 85 years and over | 583 |
| Median age (years) | 41.9 |
| Under 18 years | 4,060 |
| 16 years and over | 13,097 |
| 18 years and over | 12,671 |
| 21 years and over | 12,314 |
| 62 years and over | 4,211 |
| 65 years and over | 3,563 |
| Total population | 16,731 |
| One race | 16,657 |
| White | 16,095 |
| Black or African American | 231 |
| American Indian and Alaska Native | 4 |
| Asian | 223 |
| Native Hawaiian and Other Pacific Islander | 9 |
| Some other race | 95 |
| Two or more races | 74 |
| Citizen, VOTING AGE 18 and over population | 12,441 |
| Male Citizen, VOTING AGE 18 and over population | 5,889 |
| Female Citizen, VOTING AGE 18 and over population | 6,552 |
Social characteristics in MORTON, IL
| Total households | 7,051 |
| Family households (families) | 4,787 |
| Married-couple family | 4,189 |
| Male householder, no wife present, family | 146 |
| Female householder, no husband present, family | 452 |
| Nonfamily households | 2,264 |
| Average household size | 2.32 |
| Average family size | 2.86 |
Economic characteristics in MORTON, IL
| Total households | 7,051 |
| Less than $10,000 | 185 |
| $10,000 to $14,999 | 182 |
| $15,000 to $24,999 | 428 |
| $25,000 to $34,999 | 456 |
| $35,000 to $49,999 | 809 |
| $50,000 to $74,999 | 1,299 |
| $75,000 to $99,999 | 1,026 |
| $100,000 to $149,999 | 1,370 |
| $150,000 to $199,999 | 624 |
| $200,000 or more | 672 |
| Median household income (dollars) | 77,011 |
Housing characteristics in MORTON, IL
| Total housing units | 7,418 |
| Occupied housing units | 7,051 |
| Vacant housing units | 367 |
| Total housing units | 7,418 |
| 1-unit, detached | 4,945 |
| 1-unit, attached | 465 |
| 2 units | 206 |
| 3 or 4 units | 118 |
| 5 to 9 units | 503 |
| 10 to 19 units | 217 |
| 20 or more units | 374 |
| Mobile home | 590 |
| Boat, RV, van, etc. | 0 |
| Total housing units | 7,418 |
| Built 2014 or later | 168 |
| Built 2010 to 2013 | 352 |
| Built 2000 to 2009 | 770 |
| Built 1990 to 1999 | 900 |
| Built 1980 to 1989 | 492 |
| Built 1970 to 1979 | 1,593 |
| Built 1960 to 1969 | 1,416 |
| Built 1950 to 1959 | 827 |
| Built 1940 to 1949 | 338 |
| Built 1939 or earlier | 562 |
| Total housing units | 7,418 |
| 1 room | 13 |
| 2 rooms | 206 |
| 3 rooms | 590 |
| 4 rooms | 1,021 |
| 5 rooms | 1,186 |
| 6 rooms | 1,123 |
| 7 rooms | 888 |
| 8 rooms | 669 |
| 9 rooms or more | 1,722 |
| Median rooms | 6.1 |
| Total housing units | 7,418 |
| No bedroom | 19 |
| 1 bedroom | 533 |
| 2 bedrooms | 1,901 |
| 3 bedrooms | 2,567 |
| 4 bedrooms | 1,925 |
| 5 or more bedrooms | 473 |
| Occupied housing units | 7,051 |
| Owner-occupied | 5,288 |
| Renter-occupied | 1,763 |
| Average household size of owner-occupied unit | 2.50 |
| Average household size of renter-occupied unit | 1.79 |
| Occupied housing units | 7,051 |
| Moved in 2017 or later | 304 |
| Moved in 2015 to 2016 | 842 |
| Moved in 2010 to 2014 | 2,141 |
| Moved in 2000 to 2009 | 1,857 |
| Moved in 1990 to 1999 | 1,022 |
| Moved in 1989 and earlier | 885 |
| Owner-occupied units | 5,288 |
| Less than $50,000 | 378 |
| $50,000 to $99,999 | 341 |
| $100,000 to $149,999 | 712 |
| $150,000 to $199,999 | 1,388 |
| $200,000 to $299,999 | 1,365 |
| $300,000 to $499,999 | 959 |
| $500,000 to $999,999 | 131 |
| $1,000,000 or more | 14 |
| Median (dollars) | 192,900 |
| Owner-occupied units | 5,288 |
| Housing units with a mortgage | 2,954 |
| Housing units without a mortgage | 2,334 |
| Occupied units paying rent | 1,607 |
| Less than $500 | 138 |
| $500 to $999 | 741 |
| $1,000 to $1,499 | 569 |
| $1,500 to $1,999 | 99 |
| $2,000 to $2,499 | 38 |
| $2,500 to $2,999 | 6 |
| $3,000 or more | 16 |
| Median (dollars) | 931 |
| No rent paid | 156 |
Data is based on 2018 Census
ZIP Codes for other locations
State for MORTON
Illinois ZIP CodesOther cities in Illinois