MASON, MI ZIP Code
| City | MASON |
| State | Michigan |
| ZIP Codes count | 1 (see all) |
| Post offices count | 1 (see all) |
| Total population | 8,447 (see all) |
ZIP Code in MASON, Michigan
48854
This list contains only 5-digit ZIP codes. Use our zip code lookup by address feature to get the full 9-digit (ZIP+4) code.
List of MASON, MI ZIP Codes
| ZIP | TYPE | POPU |
|---|---|---|
| 48854 | STANDARD | 19,565 |
Post offices
MASON — Post Office™ 144 W ASH ST MASON, MI 48854-9998 |
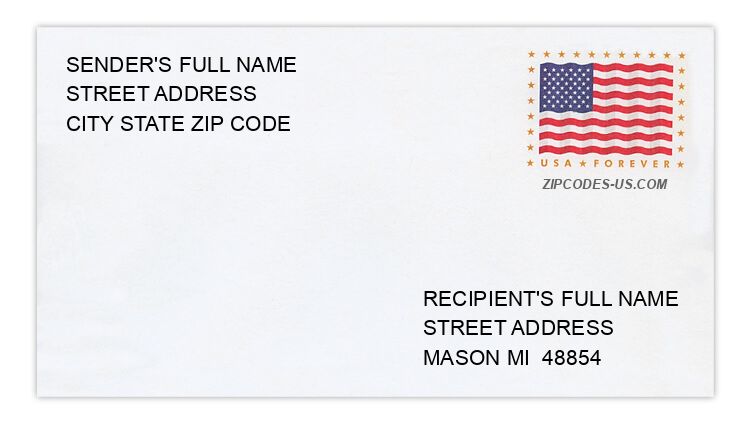
Envelope example
On the bottom center of the envelope, write the address you want your letter delivered to. Include the following on separate lines:
- Recipient's full name
- Full street address
- City, State, and ZIP Code
Using the same format, write the return address in the top left corner.
Using the full ZIP+4 Code when mailing via the USPS ensures the fastest, most accurate mailing possible. If you are not sure of the full 9-digit ZIP Code, use the 5-digit ZIP Code to avoid loss of letter or package.
The recipient address information is provided for your reference.
Address example
659 AVIATION DR
MASON MI 48854-9298
MASON MI 48854-9298
3511 BARRY PATH
MASON MI 48854-9324
MASON MI 48854-9324
166 MARK ST
MASON MI 48854-1826
MASON MI 48854-1826
1840 SERVICE RD
MASON MI 48854-9788
MASON MI 48854-9788
107 STRATFORD DR
MASON MI 48854-1342
MASON MI 48854-1342
234 W ELM ST
MASON MI 48854-1568
MASON MI 48854-1568
Map
Hover over the map to see the ZIP code
Census data for MASON, MI
Demographic and housing estimates in MASON, MI
| Total population | 8,447 |
| Male | 4,262 |
| Female | 4,185 |
| Total population | 8,447 |
| Under 5 years | 563 |
| 5 to 9 years | 329 |
| 10 to 14 years | 666 |
| 15 to 19 years | 557 |
| 20 to 24 years | 515 |
| 25 to 34 years | 1,254 |
| 35 to 44 years | 1,240 |
| 45 to 54 years | 1,084 |
| 55 to 59 years | 506 |
| 60 to 64 years | 493 |
| 65 to 74 years | 677 |
| 75 to 84 years | 394 |
| 85 years and over | 169 |
| Median age (years) | 37.0 |
| Under 18 years | 1,875 |
| 16 years and over | 6,801 |
| 18 years and over | 6,572 |
| 21 years and over | 6,235 |
| 62 years and over | 1,497 |
| 65 years and over | 1,240 |
| Total population | 8,447 |
| One race | 8,263 |
| White | 7,560 |
| Black or African American | 443 |
| American Indian and Alaska Native | 10 |
| Asian | 193 |
| Native Hawaiian and Other Pacific Islander | 0 |
| Some other race | 57 |
| Two or more races | 184 |
| Citizen, VOTING AGE 18 and over population | 6,478 |
| Male Citizen, VOTING AGE 18 and over population | 3,214 |
| Female Citizen, VOTING AGE 18 and over population | 3,264 |
Social characteristics in MASON, MI
| Total households | 3,213 |
| Family households (families) | 2,118 |
| Married-couple family | 1,561 |
| Male householder, no wife present, family | 194 |
| Female householder, no husband present, family | 363 |
| Nonfamily households | 1,095 |
| Average household size | 2.45 |
| Average family size | 2.95 |
Economic characteristics in MASON, MI
| Total households | 3,213 |
| Less than $10,000 | 105 |
| $10,000 to $14,999 | 48 |
| $15,000 to $24,999 | 256 |
| $25,000 to $34,999 | 299 |
| $35,000 to $49,999 | 544 |
| $50,000 to $74,999 | 778 |
| $75,000 to $99,999 | 433 |
| $100,000 to $149,999 | 491 |
| $150,000 to $199,999 | 166 |
| $200,000 or more | 93 |
| Median household income (dollars) | 60,661 |
Housing characteristics in MASON, MI
| Total housing units | 3,432 |
| Occupied housing units | 3,213 |
| Vacant housing units | 219 |
| Total housing units | 3,432 |
| 1-unit, detached | 1,902 |
| 1-unit, attached | 210 |
| 2 units | 80 |
| 3 or 4 units | 141 |
| 5 to 9 units | 403 |
| 10 to 19 units | 304 |
| 20 or more units | 100 |
| Mobile home | 292 |
| Boat, RV, van, etc. | 0 |
| Total housing units | 3,432 |
| Built 2014 or later | 17 |
| Built 2010 to 2013 | 98 |
| Built 2000 to 2009 | 666 |
| Built 1990 to 1999 | 479 |
| Built 1980 to 1989 | 274 |
| Built 1970 to 1979 | 413 |
| Built 1960 to 1969 | 369 |
| Built 1950 to 1959 | 253 |
| Built 1940 to 1949 | 153 |
| Built 1939 or earlier | 710 |
| Total housing units | 3,432 |
| 1 room | 10 |
| 2 rooms | 44 |
| 3 rooms | 229 |
| 4 rooms | 688 |
| 5 rooms | 692 |
| 6 rooms | 521 |
| 7 rooms | 471 |
| 8 rooms | 429 |
| 9 rooms or more | 348 |
| Median rooms | 5.6 |
| Total housing units | 3,432 |
| No bedroom | 21 |
| 1 bedroom | 241 |
| 2 bedrooms | 1,033 |
| 3 bedrooms | 1,468 |
| 4 bedrooms | 517 |
| 5 or more bedrooms | 152 |
| Occupied housing units | 3,213 |
| Owner-occupied | 2,042 |
| Renter-occupied | 1,171 |
| Average household size of owner-occupied unit | 2.55 |
| Average household size of renter-occupied unit | 2.29 |
| Occupied housing units | 3,213 |
| Moved in 2017 or later | 232 |
| Moved in 2015 to 2016 | 258 |
| Moved in 2010 to 2014 | 1,189 |
| Moved in 2000 to 2009 | 888 |
| Moved in 1990 to 1999 | 347 |
| Moved in 1989 and earlier | 299 |
| Owner-occupied units | 2,042 |
| Less than $50,000 | 262 |
| $50,000 to $99,999 | 440 |
| $100,000 to $149,999 | 577 |
| $150,000 to $199,999 | 420 |
| $200,000 to $299,999 | 185 |
| $300,000 to $499,999 | 147 |
| $500,000 to $999,999 | 11 |
| $1,000,000 or more | 0 |
| Median (dollars) | 124,800 |
| Owner-occupied units | 2,042 |
| Housing units with a mortgage | 1,439 |
| Housing units without a mortgage | 603 |
| Occupied units paying rent | 1,130 |
| Less than $500 | 54 |
| $500 to $999 | 565 |
| $1,000 to $1,499 | 491 |
| $1,500 to $1,999 | 20 |
| $2,000 to $2,499 | 0 |
| $2,500 to $2,999 | 0 |
| $3,000 or more | 0 |
| Median (dollars) | 972 |
| No rent paid | 41 |
Data is based on 2018 Census
ZIP Codes for other locations
State for MASON
Michigan ZIP CodesOther cities in Michigan