MATTAWAN, MI ZIP Code
| City | MATTAWAN |
| State | Michigan |
| ZIP Codes count | 1 (see all) |
| Post offices count | 1 (see all) |
| Total population | 2,333 (see all) |
ZIP Code in MATTAWAN, Michigan
49071
This list contains only 5-digit ZIP codes. Use our zip code lookup by address feature to get the full 9-digit (ZIP+4) code.
List of MATTAWAN, MI ZIP Codes
| ZIP | TYPE | POPU |
|---|---|---|
| 49071 | STANDARD | 11,522 |
Post offices
MATTAWAN — Post Office™ 55680 N MAIN ST MATTAWAN, MI 49071-9800 |
Envelope example
On the bottom center of the envelope, write the address you want your letter delivered to. Include the following on separate lines:
- Recipient's full name
- Full street address
- City, State, and ZIP Code
Using the same format, write the return address in the top left corner.
Using the full ZIP+4 Code when mailing via the USPS ensures the fastest, most accurate mailing possible. If you are not sure of the full 9-digit ZIP Code, use the 5-digit ZIP Code to avoid loss of letter or package.
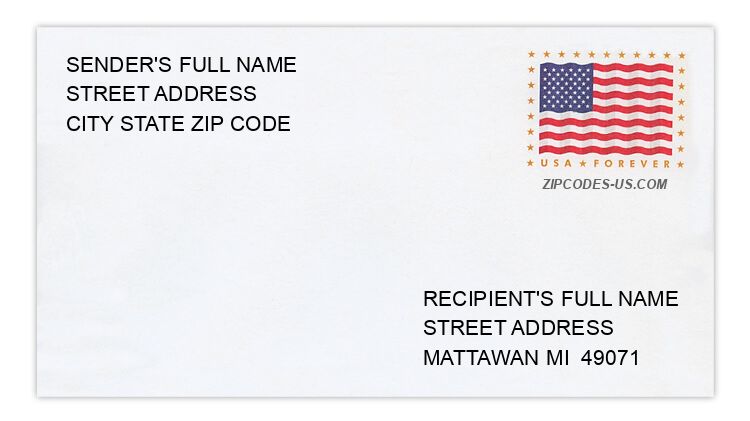
The recipient address information is provided for your reference.
Address example
49283 BEULAH WAY
MATTAWAN MI 49071-8860
MATTAWAN MI 49071-8860
25257 EISENHOWER DR
MATTAWAN MI 49071-9306
MATTAWAN MI 49071-9306
25378 MACARTHUR DR
MATTAWAN MI 49071-9336
MATTAWAN MI 49071-9336
23313 PRAIRIE VIEW CT
MATTAWAN MI 49071-9712
MATTAWAN MI 49071-9712
52494 S POINT DR
MATTAWAN MI 49071-9353
MATTAWAN MI 49071-9353
57508 WESTERN ST
MATTAWAN MI 49071-9508
MATTAWAN MI 49071-9508
Map
Hover over the map to see the ZIP code
Census data for MATTAWAN, MI
Demographic and housing estimates in MATTAWAN, MI
| Total population | 2,333 |
| Male | 1,038 |
| Female | 1,295 |
| Total population | 2,333 |
| Under 5 years | 170 |
| 5 to 9 years | 131 |
| 10 to 14 years | 265 |
| 15 to 19 years | 162 |
| 20 to 24 years | 144 |
| 25 to 34 years | 278 |
| 35 to 44 years | 291 |
| 45 to 54 years | 286 |
| 55 to 59 years | 144 |
| 60 to 64 years | 118 |
| 65 to 74 years | 278 |
| 75 to 84 years | 42 |
| 85 years and over | 24 |
| Median age (years) | 35.5 |
| Under 18 years | 696 |
| 16 years and over | 1,675 |
| 18 years and over | 1,637 |
| 21 years and over | 1,584 |
| 62 years and over | 440 |
| 65 years and over | 344 |
| Total population | 2,333 |
| One race | 2,235 |
| White | 2,142 |
| Black or African American | 0 |
| American Indian and Alaska Native | 0 |
| Asian | 59 |
| Native Hawaiian and Other Pacific Islander | 0 |
| Some other race | 34 |
| Two or more races | 98 |
| Citizen, VOTING AGE 18 and over population | 1,605 |
| Male Citizen, VOTING AGE 18 and over population | 701 |
| Female Citizen, VOTING AGE 18 and over population | 904 |
Social characteristics in MATTAWAN, MI
| Total households | 928 |
| Family households (families) | 598 |
| Married-couple family | 385 |
| Male householder, no wife present, family | 26 |
| Female householder, no husband present, family | 187 |
| Nonfamily households | 330 |
| Average household size | 2.51 |
| Average family size | 3.05 |
Economic characteristics in MATTAWAN, MI
| Total households | 928 |
| Less than $10,000 | 75 |
| $10,000 to $14,999 | 39 |
| $15,000 to $24,999 | 168 |
| $25,000 to $34,999 | 77 |
| $35,000 to $49,999 | 128 |
| $50,000 to $74,999 | 196 |
| $75,000 to $99,999 | 70 |
| $100,000 to $149,999 | 139 |
| $150,000 to $199,999 | 30 |
| $200,000 or more | 6 |
| Median household income (dollars) | 47,197 |
Housing characteristics in MATTAWAN, MI
| Total housing units | 1,041 |
| Occupied housing units | 928 |
| Vacant housing units | 113 |
| Total housing units | 1,041 |
| 1-unit, detached | 537 |
| 1-unit, attached | 38 |
| 2 units | 46 |
| 3 or 4 units | 44 |
| 5 to 9 units | 30 |
| 10 to 19 units | 0 |
| 20 or more units | 20 |
| Mobile home | 326 |
| Boat, RV, van, etc. | 0 |
| Total housing units | 1,041 |
| Built 2014 or later | 21 |
| Built 2010 to 2013 | 12 |
| Built 2000 to 2009 | 44 |
| Built 1990 to 1999 | 221 |
| Built 1980 to 1989 | 171 |
| Built 1970 to 1979 | 305 |
| Built 1960 to 1969 | 73 |
| Built 1950 to 1959 | 65 |
| Built 1940 to 1949 | 20 |
| Built 1939 or earlier | 109 |
| Total housing units | 1,041 |
| 1 room | 6 |
| 2 rooms | 17 |
| 3 rooms | 78 |
| 4 rooms | 206 |
| 5 rooms | 276 |
| 6 rooms | 145 |
| 7 rooms | 184 |
| 8 rooms | 47 |
| 9 rooms or more | 82 |
| Median rooms | 5.3 |
| Total housing units | 1,041 |
| No bedroom | 6 |
| 1 bedroom | 48 |
| 2 bedrooms | 345 |
| 3 bedrooms | 467 |
| 4 bedrooms | 157 |
| 5 or more bedrooms | 18 |
| Occupied housing units | 928 |
| Owner-occupied | 684 |
| Renter-occupied | 244 |
| Average household size of owner-occupied unit | 2.47 |
| Average household size of renter-occupied unit | 2.64 |
| Occupied housing units | 928 |
| Moved in 2017 or later | 56 |
| Moved in 2015 to 2016 | 78 |
| Moved in 2010 to 2014 | 302 |
| Moved in 2000 to 2009 | 217 |
| Moved in 1990 to 1999 | 110 |
| Moved in 1989 and earlier | 165 |
| Owner-occupied units | 684 |
| Less than $50,000 | 184 |
| $50,000 to $99,999 | 127 |
| $100,000 to $149,999 | 225 |
| $150,000 to $199,999 | 84 |
| $200,000 to $299,999 | 47 |
| $300,000 to $499,999 | 0 |
| $500,000 to $999,999 | 17 |
| $1,000,000 or more | 0 |
| Median (dollars) | 107,300 |
| Owner-occupied units | 684 |
| Housing units with a mortgage | 342 |
| Housing units without a mortgage | 342 |
| Occupied units paying rent | 232 |
| Less than $500 | 38 |
| $500 to $999 | 113 |
| $1,000 to $1,499 | 81 |
| $1,500 to $1,999 | 0 |
| $2,000 to $2,499 | 0 |
| $2,500 to $2,999 | 0 |
| $3,000 or more | 0 |
| Median (dollars) | 873 |
| No rent paid | 12 |
Data is based on 2018 Census
ZIP Codes for other locations
State for MATTAWAN
Michigan ZIP CodesOther cities in Michigan