BYHALIA, MS ZIP Code
| City | BYHALIA |
| State | Mississippi |
| ZIP Codes count | 1 (see all) |
| Post offices count | 1 (see all) |
| Total population | 1,537 (see all) |
ZIP Code in BYHALIA, Mississippi
38611
This list contains only 5-digit ZIP codes. Use our zip code lookup by address feature to get the full 9-digit (ZIP+4) code.
List of BYHALIA, MS ZIP Codes
| ZIP | TYPE | POPU |
|---|---|---|
| 38611 | STANDARD | 16,114 |
Post offices
BYHALIA — Post Office™ 8140 HIGHWAY 178 BYHALIA, MS 38611-9998 |
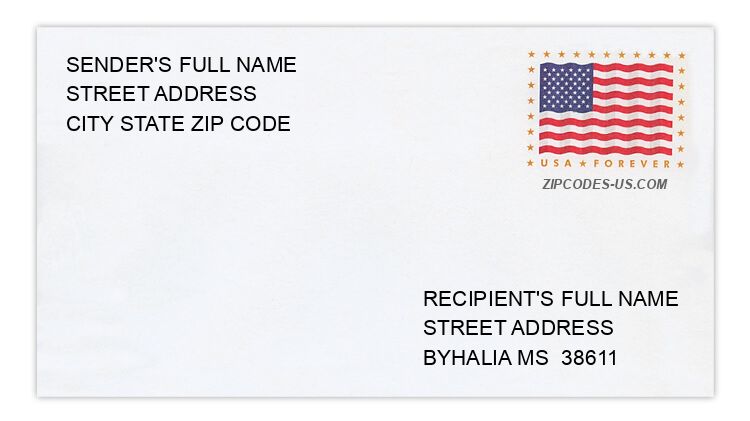
Envelope example
On the bottom center of the envelope, write the address you want your letter delivered to. Include the following on separate lines:
- Recipient's full name
- Full street address
- City, State, and ZIP Code
Using the same format, write the return address in the top left corner.
Using the full ZIP+4 Code when mailing via the USPS ensures the fastest, most accurate mailing possible. If you are not sure of the full 9-digit ZIP Code, use the 5-digit ZIP Code to avoid loss of letter or package.
The recipient address information is provided for your reference.
Address example
13137 ABERNATHY RD
BYHALIA MS 38611-9016
BYHALIA MS 38611-9016
258 DOUGLAS RD
BYHALIA MS 38611-6808
BYHALIA MS 38611-6808
131 HYLINE DR
BYHALIA MS 38611-9141
BYHALIA MS 38611-9141
632 LAKE HILL RD
BYHALIA MS 38611-9332
BYHALIA MS 38611-9332
52 MOORE XING S
BYHALIA MS 38611-6946
BYHALIA MS 38611-6946
12553 PEBBLE RIDGE DR
BYHALIA MS 38611-4402
BYHALIA MS 38611-4402
Map
Hover over the map to see the ZIP code
Census data for BYHALIA, MS
Demographic and housing estimates in BYHALIA, MS
| Total population | 1,537 |
| Male | 678 |
| Female | 859 |
| Total population | 1,537 |
| Under 5 years | 71 |
| 5 to 9 years | 118 |
| 10 to 14 years | 140 |
| 15 to 19 years | 139 |
| 20 to 24 years | 120 |
| 25 to 34 years | 102 |
| 35 to 44 years | 243 |
| 45 to 54 years | 164 |
| 55 to 59 years | 69 |
| 60 to 64 years | 84 |
| 65 to 74 years | 175 |
| 75 to 84 years | 83 |
| 85 years and over | 29 |
| Median age (years) | 38.6 |
| Under 18 years | 455 |
| 16 years and over | 1,152 |
| 18 years and over | 1,082 |
| 21 years and over | 1,001 |
| 62 years and over | 325 |
| 65 years and over | 287 |
| Total population | 1,537 |
| One race | 1,534 |
| White | 586 |
| Black or African American | 909 |
| American Indian and Alaska Native | 0 |
| Asian | 0 |
| Native Hawaiian and Other Pacific Islander | 0 |
| Some other race | 39 |
| Two or more races | 3 |
| Citizen, VOTING AGE 18 and over population | 1,074 |
| Male Citizen, VOTING AGE 18 and over population | 458 |
| Female Citizen, VOTING AGE 18 and over population | 616 |
Social characteristics in BYHALIA, MS
| Total households | 615 |
| Family households (families) | 409 |
| Married-couple family | 176 |
| Male householder, no wife present, family | 41 |
| Female householder, no husband present, family | 192 |
| Nonfamily households | 206 |
| Average household size | 2.40 |
| Average family size | 3.02 |
Economic characteristics in BYHALIA, MS
| Total households | 615 |
| Less than $10,000 | 77 |
| $10,000 to $14,999 | 108 |
| $15,000 to $24,999 | 94 |
| $25,000 to $34,999 | 93 |
| $35,000 to $49,999 | 60 |
| $50,000 to $74,999 | 70 |
| $75,000 to $99,999 | 40 |
| $100,000 to $149,999 | 56 |
| $150,000 to $199,999 | 11 |
| $200,000 or more | 6 |
| Median household income (dollars) | 26,827 |
Housing characteristics in BYHALIA, MS
| Total housing units | 698 |
| Occupied housing units | 615 |
| Vacant housing units | 83 |
| Total housing units | 698 |
| 1-unit, detached | 372 |
| 1-unit, attached | 18 |
| 2 units | 29 |
| 3 or 4 units | 23 |
| 5 to 9 units | 84 |
| 10 to 19 units | 14 |
| 20 or more units | 21 |
| Mobile home | 130 |
| Boat, RV, van, etc. | 7 |
| Total housing units | 698 |
| Built 2014 or later | 6 |
| Built 2010 to 2013 | 3 |
| Built 2000 to 2009 | 105 |
| Built 1990 to 1999 | 74 |
| Built 1980 to 1989 | 149 |
| Built 1970 to 1979 | 198 |
| Built 1960 to 1969 | 60 |
| Built 1950 to 1959 | 28 |
| Built 1940 to 1949 | 18 |
| Built 1939 or earlier | 57 |
| Total housing units | 698 |
| 1 room | 26 |
| 2 rooms | 17 |
| 3 rooms | 75 |
| 4 rooms | 158 |
| 5 rooms | 188 |
| 6 rooms | 113 |
| 7 rooms | 45 |
| 8 rooms | 33 |
| 9 rooms or more | 43 |
| Median rooms | 4.9 |
| Total housing units | 698 |
| No bedroom | 26 |
| 1 bedroom | 94 |
| 2 bedrooms | 202 |
| 3 bedrooms | 325 |
| 4 bedrooms | 46 |
| 5 or more bedrooms | 5 |
| Occupied housing units | 615 |
| Owner-occupied | 331 |
| Renter-occupied | 284 |
| Average household size of owner-occupied unit | 2.51 |
| Average household size of renter-occupied unit | 2.28 |
| Occupied housing units | 615 |
| Moved in 2017 or later | 17 |
| Moved in 2015 to 2016 | 41 |
| Moved in 2010 to 2014 | 163 |
| Moved in 2000 to 2009 | 228 |
| Moved in 1990 to 1999 | 55 |
| Moved in 1989 and earlier | 111 |
| Owner-occupied units | 331 |
| Less than $50,000 | 62 |
| $50,000 to $99,999 | 68 |
| $100,000 to $149,999 | 67 |
| $150,000 to $199,999 | 77 |
| $200,000 to $299,999 | 35 |
| $300,000 to $499,999 | 19 |
| $500,000 to $999,999 | 3 |
| $1,000,000 or more | 0 |
| Median (dollars) | 119,300 |
| Owner-occupied units | 331 |
| Housing units with a mortgage | 147 |
| Housing units without a mortgage | 184 |
| Occupied units paying rent | 268 |
| Less than $500 | 158 |
| $500 to $999 | 108 |
| $1,000 to $1,499 | 2 |
| $1,500 to $1,999 | 0 |
| $2,000 to $2,499 | 0 |
| $2,500 to $2,999 | 0 |
| $3,000 or more | 0 |
| Median (dollars) | 463 |
| No rent paid | 16 |
Data is based on 2018 Census
ZIP Codes for other locations
State for BYHALIA
Mississippi ZIP CodesOther cities in Mississippi