ORRVILLE, OH ZIP Code
| City | ORRVILLE |
| State | Ohio |
| ZIP Codes count | 1 (see all) |
| Post offices count | 1 (see all) |
| Total population | 8,239 (see all) |
ZIP Code in ORRVILLE, Ohio
44667
This list contains only 5-digit ZIP codes. Use our zip code lookup by address feature to get the full 9-digit (ZIP+4) code.
List of ORRVILLE, OH ZIP Codes
| ZIP | TYPE | POPU |
|---|---|---|
| 44667 | STANDARD | 13,643 |
Post offices
ORRVILLE — Post Office™ 145 N VINE ST ORRVILLE, OH 44667-9998 |
Envelope example
On the bottom center of the envelope, write the address you want your letter delivered to. Include the following on separate lines:
- Recipient's full name
- Full street address
- City, State, and ZIP Code
Using the same format, write the return address in the top left corner.
Using the full ZIP+4 Code when mailing via the USPS ensures the fastest, most accurate mailing possible. If you are not sure of the full 9-digit ZIP Code, use the 5-digit ZIP Code to avoid loss of letter or package.
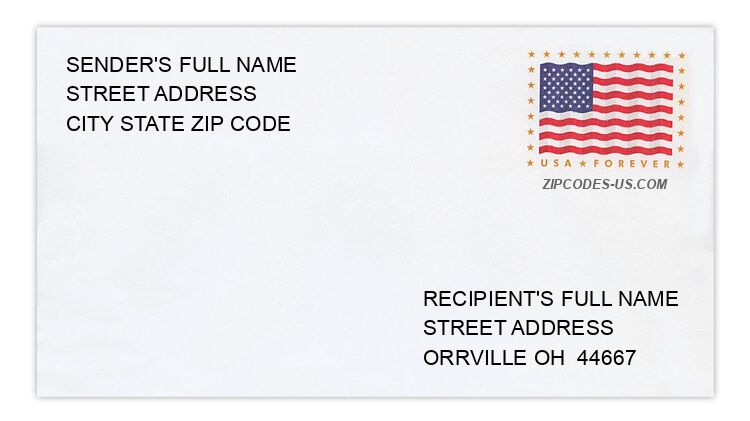
The recipient address information is provided for your reference.
Address example
206 CHATEAU CIR
ORRVILLE OH 44667-1430
ORRVILLE OH 44667-1430
166 E CHURCH ST
ORRVILLE OH 44667-16ND
ORRVILLE OH 44667-16ND
8231 EDINBURGH WOODS RD
ORRVILLE OH 44667-9378
ORRVILLE OH 44667-9378
3494 MISERE RD
ORRVILLE OH 44667-9279
ORRVILLE OH 44667-9279
2135 S CROWN HILL RD
ORRVILLE OH 44667-9556
ORRVILLE OH 44667-9556
176 UNION ST
ORRVILLE OH 44667-1276
ORRVILLE OH 44667-1276
Map
Hover over the map to see the ZIP code
Census data for ORRVILLE, OH
Demographic and housing estimates in ORRVILLE, OH
| Total population | 8,239 |
| Male | 4,099 |
| Female | 4,140 |
| Total population | 8,239 |
| Under 5 years | 601 |
| 5 to 9 years | 427 |
| 10 to 14 years | 394 |
| 15 to 19 years | 417 |
| 20 to 24 years | 532 |
| 25 to 34 years | 1,258 |
| 35 to 44 years | 948 |
| 45 to 54 years | 982 |
| 55 to 59 years | 592 |
| 60 to 64 years | 436 |
| 65 to 74 years | 814 |
| 75 to 84 years | 576 |
| 85 years and over | 262 |
| Median age (years) | 40.1 |
| Under 18 years | 1,762 |
| 16 years and over | 6,720 |
| 18 years and over | 6,477 |
| 21 years and over | 6,240 |
| 62 years and over | 1,912 |
| 65 years and over | 1,652 |
| Total population | 8,239 |
| One race | 7,854 |
| White | 7,034 |
| Black or African American | 141 |
| American Indian and Alaska Native | 103 |
| Asian | 164 |
| Native Hawaiian and Other Pacific Islander | 7 |
| Some other race | 405 |
| Two or more races | 385 |
| Citizen, VOTING AGE 18 and over population | 6,316 |
| Male Citizen, VOTING AGE 18 and over population | 3,059 |
| Female Citizen, VOTING AGE 18 and over population | 3,257 |
Social characteristics in ORRVILLE, OH
| Total households | 3,469 |
| Family households (families) | 2,374 |
| Married-couple family | 1,840 |
| Male householder, no wife present, family | 195 |
| Female householder, no husband present, family | 339 |
| Nonfamily households | 1,095 |
| Average household size | 2.34 |
| Average family size | 2.80 |
Economic characteristics in ORRVILLE, OH
| Total households | 3,469 |
| Less than $10,000 | 147 |
| $10,000 to $14,999 | 68 |
| $15,000 to $24,999 | 456 |
| $25,000 to $34,999 | 375 |
| $35,000 to $49,999 | 610 |
| $50,000 to $74,999 | 860 |
| $75,000 to $99,999 | 369 |
| $100,000 to $149,999 | 418 |
| $150,000 to $199,999 | 89 |
| $200,000 or more | 77 |
| Median household income (dollars) | 52,871 |
Housing characteristics in ORRVILLE, OH
| Total housing units | 3,675 |
| Occupied housing units | 3,469 |
| Vacant housing units | 206 |
| Total housing units | 3,675 |
| 1-unit, detached | 2,366 |
| 1-unit, attached | 212 |
| 2 units | 316 |
| 3 or 4 units | 202 |
| 5 to 9 units | 280 |
| 10 to 19 units | 136 |
| 20 or more units | 91 |
| Mobile home | 72 |
| Boat, RV, van, etc. | 0 |
| Total housing units | 3,675 |
| Built 2014 or later | 27 |
| Built 2010 to 2013 | 28 |
| Built 2000 to 2009 | 256 |
| Built 1990 to 1999 | 538 |
| Built 1980 to 1989 | 384 |
| Built 1970 to 1979 | 579 |
| Built 1960 to 1969 | 371 |
| Built 1950 to 1959 | 409 |
| Built 1940 to 1949 | 182 |
| Built 1939 or earlier | 901 |
| Total housing units | 3,675 |
| 1 room | 29 |
| 2 rooms | 32 |
| 3 rooms | 297 |
| 4 rooms | 451 |
| 5 rooms | 732 |
| 6 rooms | 773 |
| 7 rooms | 497 |
| 8 rooms | 326 |
| 9 rooms or more | 538 |
| Median rooms | 5.9 |
| Total housing units | 3,675 |
| No bedroom | 34 |
| 1 bedroom | 376 |
| 2 bedrooms | 1,089 |
| 3 bedrooms | 1,473 |
| 4 bedrooms | 644 |
| 5 or more bedrooms | 59 |
| Occupied housing units | 3,469 |
| Owner-occupied | 2,251 |
| Renter-occupied | 1,218 |
| Average household size of owner-occupied unit | 2.44 |
| Average household size of renter-occupied unit | 2.16 |
| Occupied housing units | 3,469 |
| Moved in 2017 or later | 167 |
| Moved in 2015 to 2016 | 378 |
| Moved in 2010 to 2014 | 958 |
| Moved in 2000 to 2009 | 886 |
| Moved in 1990 to 1999 | 539 |
| Moved in 1989 and earlier | 541 |
| Owner-occupied units | 2,251 |
| Less than $50,000 | 122 |
| $50,000 to $99,999 | 596 |
| $100,000 to $149,999 | 902 |
| $150,000 to $199,999 | 395 |
| $200,000 to $299,999 | 151 |
| $300,000 to $499,999 | 59 |
| $500,000 to $999,999 | 26 |
| $1,000,000 or more | 0 |
| Median (dollars) | 118,200 |
| Owner-occupied units | 2,251 |
| Housing units with a mortgage | 1,317 |
| Housing units without a mortgage | 934 |
| Occupied units paying rent | 1,179 |
| Less than $500 | 68 |
| $500 to $999 | 950 |
| $1,000 to $1,499 | 116 |
| $1,500 to $1,999 | 18 |
| $2,000 to $2,499 | 5 |
| $2,500 to $2,999 | 13 |
| $3,000 or more | 9 |
| Median (dollars) | 762 |
| No rent paid | 39 |
Data is based on 2018 Census
ZIP Codes for other locations
State for ORRVILLE
Ohio ZIP CodesOther cities in Ohio