BURLESON, TX ZIP Code
| City | BURLESON |
| State | Texas |
| ZIP Codes count | 2 (see all) |
| Post offices count | 1 (see all) |
| Total population | 44,629 (see all) |
ZIP Codes in BURLESON, Texas
76028, 76097
This list contains only 5-digit ZIP codes. Use our zip code lookup by address feature to get the full 9-digit (ZIP+4) code.
List of BURLESON, TX ZIP Codes
| ZIP | TYPE | POPU |
|---|---|---|
| 76028 | STANDARD | 74,217 |
| 76097 | PO BOX | – |
Post offices
BURLESON — Post Office™ 232 SW JOHNSON AVE BURLESON, TX 76028-9998 |
Envelope example
On the bottom center of the envelope, write the address you want your letter delivered to. Include the following on separate lines:
- Recipient's full name
- Full street address
- City, State, and ZIP Code
Using the same format, write the return address in the top left corner.
Using the full ZIP+4 Code when mailing via the USPS ensures the fastest, most accurate mailing possible. If you are not sure of the full 9-digit ZIP Code, use the 5-digit ZIP Code to avoid loss of letter or package.
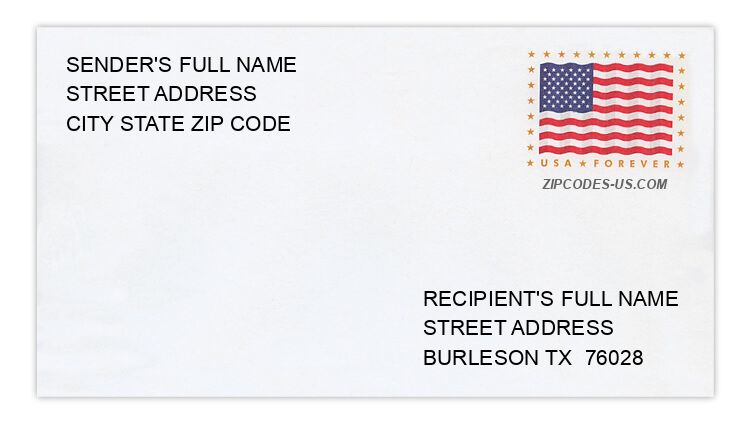
The recipient address information is provided for your reference.
Address example
737 BLUE MARLIN DR
BURLESON TX 76028-8143
BURLESON TX 76028-8143
823 FARRIS RD
BURLESON TX 76028-24ND
BURLESON TX 76028-24ND
403 HUDSON LN
BURLESON TX 76028-8003
BURLESON TX 76028-8003
781 ROYAL OAK CT
BURLESON TX 76028-6201
BURLESON TX 76028-6201
1218 SHELLEY DR
BURLESON TX 76028-9407
BURLESON TX 76028-9407
901 VINEWOOD CT
BURLESON TX 76028-6797
BURLESON TX 76028-6797
Map
Hover over the map to see the ZIP code
Census data for BURLESON, TX
Demographic and housing estimates in BURLESON, TX
| Total population | 44,629 |
| Male | 21,118 |
| Female | 23,511 |
| Total population | 44,629 |
| Under 5 years | 3,669 |
| 5 to 9 years | 3,668 |
| 10 to 14 years | 3,491 |
| 15 to 19 years | 2,652 |
| 20 to 24 years | 2,547 |
| 25 to 34 years | 6,269 |
| 35 to 44 years | 7,058 |
| 45 to 54 years | 5,160 |
| 55 to 59 years | 2,706 |
| 60 to 64 years | 2,095 |
| 65 to 74 years | 3,330 |
| 75 to 84 years | 1,539 |
| 85 years and over | 445 |
| Median age (years) | 35.0 |
| Under 18 years | 12,565 |
| 16 years and over | 33,119 |
| 18 years and over | 32,064 |
| 21 years and over | 30,902 |
| 62 years and over | 6,545 |
| 65 years and over | 5,314 |
| Total population | 44,629 |
| One race | 43,163 |
| White | 40,095 |
| Black or African American | 1,829 |
| American Indian and Alaska Native | 145 |
| Asian | 642 |
| Native Hawaiian and Other Pacific Islander | 79 |
| Some other race | 373 |
| Two or more races | 1,466 |
| Citizen, VOTING AGE 18 and over population | 31,655 |
| Male Citizen, VOTING AGE 18 and over population | 15,125 |
| Female Citizen, VOTING AGE 18 and over population | 16,530 |
Social characteristics in BURLESON, TX
| Total households | 15,349 |
| Family households (families) | 12,081 |
| Married-couple family | 9,251 |
| Male householder, no wife present, family | 580 |
| Female householder, no husband present, family | 2,250 |
| Nonfamily households | 3,268 |
| Average household size | 2.90 |
| Average family size | 3.26 |
Economic characteristics in BURLESON, TX
| Total households | 15,349 |
| Less than $10,000 | 265 |
| $10,000 to $14,999 | 258 |
| $15,000 to $24,999 | 777 |
| $25,000 to $34,999 | 835 |
| $35,000 to $49,999 | 2,143 |
| $50,000 to $74,999 | 3,108 |
| $75,000 to $99,999 | 2,491 |
| $100,000 to $149,999 | 3,414 |
| $150,000 to $199,999 | 1,150 |
| $200,000 or more | 908 |
| Median household income (dollars) | 77,342 |
Housing characteristics in BURLESON, TX
| Total housing units | 16,209 |
| Occupied housing units | 15,349 |
| Vacant housing units | 860 |
| Total housing units | 16,209 |
| 1-unit, detached | 13,388 |
| 1-unit, attached | 404 |
| 2 units | 479 |
| 3 or 4 units | 171 |
| 5 to 9 units | 268 |
| 10 to 19 units | 482 |
| 20 or more units | 569 |
| Mobile home | 448 |
| Boat, RV, van, etc. | 0 |
| Total housing units | 16,209 |
| Built 2014 or later | 1,001 |
| Built 2010 to 2013 | 1,743 |
| Built 2000 to 2009 | 5,509 |
| Built 1990 to 1999 | 2,234 |
| Built 1980 to 1989 | 1,566 |
| Built 1970 to 1979 | 2,151 |
| Built 1960 to 1969 | 1,444 |
| Built 1950 to 1959 | 455 |
| Built 1940 to 1949 | 73 |
| Built 1939 or earlier | 33 |
| Total housing units | 16,209 |
| 1 room | 75 |
| 2 rooms | 117 |
| 3 rooms | 489 |
| 4 rooms | 1,485 |
| 5 rooms | 5,452 |
| 6 rooms | 3,664 |
| 7 rooms | 1,893 |
| 8 rooms | 1,131 |
| 9 rooms or more | 1,903 |
| Median rooms | 5.6 |
| Total housing units | 16,209 |
| No bedroom | 89 |
| 1 bedroom | 576 |
| 2 bedrooms | 1,586 |
| 3 bedrooms | 9,862 |
| 4 bedrooms | 3,618 |
| 5 or more bedrooms | 478 |
| Occupied housing units | 15,349 |
| Owner-occupied | 11,182 |
| Renter-occupied | 4,167 |
| Average household size of owner-occupied unit | 2.91 |
| Average household size of renter-occupied unit | 2.88 |
| Occupied housing units | 15,349 |
| Moved in 2017 or later | 1,301 |
| Moved in 2015 to 2016 | 2,234 |
| Moved in 2010 to 2014 | 4,873 |
| Moved in 2000 to 2009 | 4,629 |
| Moved in 1990 to 1999 | 1,006 |
| Moved in 1989 and earlier | 1,306 |
| Owner-occupied units | 11,182 |
| Less than $50,000 | 326 |
| $50,000 to $99,999 | 1,329 |
| $100,000 to $149,999 | 2,772 |
| $150,000 to $199,999 | 2,833 |
| $200,000 to $299,999 | 2,939 |
| $300,000 to $499,999 | 824 |
| $500,000 to $999,999 | 123 |
| $1,000,000 or more | 36 |
| Median (dollars) | 167,100 |
| Owner-occupied units | 11,182 |
| Housing units with a mortgage | 8,022 |
| Housing units without a mortgage | 3,160 |
| Occupied units paying rent | 4,029 |
| Less than $500 | 70 |
| $500 to $999 | 932 |
| $1,000 to $1,499 | 2,056 |
| $1,500 to $1,999 | 787 |
| $2,000 to $2,499 | 165 |
| $2,500 to $2,999 | 9 |
| $3,000 or more | 10 |
| Median (dollars) | 1,229 |
| No rent paid | 138 |
Data is based on 2018 Census
ZIP Codes for other locations
State for BURLESON
Texas ZIP CodesOther cities in Texas