BURNET, TX ZIP Code
| City | BURNET |
| State | Texas |
| ZIP Codes count | 1 (see all) |
| Post offices count | 1 (see all) |
| Total population | 6,216 (see all) |
ZIP Code in BURNET, Texas
78611
This list contains only 5-digit ZIP codes. Use our zip code lookup by address feature to get the full 9-digit (ZIP+4) code.
List of BURNET, TX ZIP Codes
| ZIP | TYPE | POPU |
|---|---|---|
| 78611 | STANDARD | 12,938 |
Post offices
BURNET — Post Office™ 508 E JACKSON ST BURNET, TX 78611-9998 |
Envelope example
On the bottom center of the envelope, write the address you want your letter delivered to. Include the following on separate lines:
- Recipient's full name
- Full street address
- City, State, and ZIP Code
Using the same format, write the return address in the top left corner.
Using the full ZIP+4 Code when mailing via the USPS ensures the fastest, most accurate mailing possible. If you are not sure of the full 9-digit ZIP Code, use the 5-digit ZIP Code to avoid loss of letter or package.
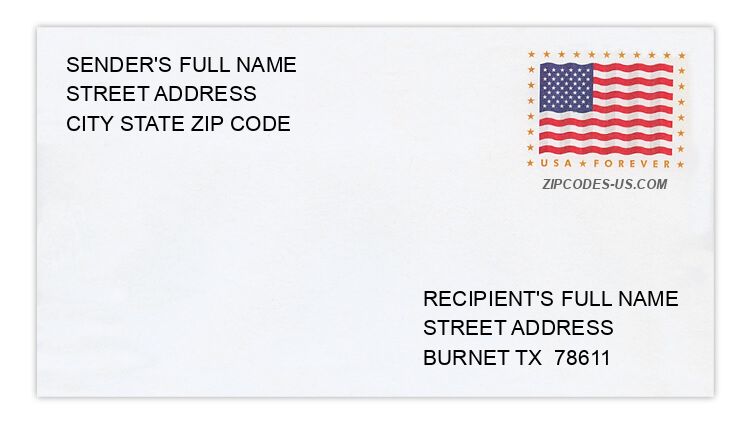
The recipient address information is provided for your reference.
Address example
1436 COUNTY ROAD 128
BURNET TX 78611-5700
BURNET TX 78611-5700
468 EVERGREEN CIR
BURNET TX 78611-1407
BURNET TX 78611-1407
187 FANIN ST
BURNET TX 78611-2309
BURNET TX 78611-2309
102 GREGORY LN
BURNET TX 78611-5885
BURNET TX 78611-5885
895 IROQUOIS DR
BURNET TX 78611-5459
BURNET TX 78611-5459
302 NATURE DR
BURNET TX 78611-2947
BURNET TX 78611-2947
Map
Hover over the map to see the ZIP code
Census data for BURNET, TX
Demographic and housing estimates in BURNET, TX
| Total population | 6,216 |
| Male | 3,184 |
| Female | 3,032 |
| Total population | 6,216 |
| Under 5 years | 198 |
| 5 to 9 years | 378 |
| 10 to 14 years | 469 |
| 15 to 19 years | 310 |
| 20 to 24 years | 371 |
| 25 to 34 years | 1,029 |
| 35 to 44 years | 800 |
| 45 to 54 years | 811 |
| 55 to 59 years | 312 |
| 60 to 64 years | 505 |
| 65 to 74 years | 507 |
| 75 to 84 years | 320 |
| 85 years and over | 206 |
| Median age (years) | 39.7 |
| Under 18 years | 1,203 |
| 16 years and over | 5,103 |
| 18 years and over | 5,013 |
| 21 years and over | 4,737 |
| 62 years and over | 1,339 |
| 65 years and over | 1,033 |
| Total population | 6,216 |
| One race | 6,018 |
| White | 5,569 |
| Black or African American | 130 |
| American Indian and Alaska Native | 85 |
| Asian | 38 |
| Native Hawaiian and Other Pacific Islander | 0 |
| Some other race | 196 |
| Two or more races | 198 |
| Citizen, VOTING AGE 18 and over population | 4,959 |
| Male Citizen, VOTING AGE 18 and over population | 2,506 |
| Female Citizen, VOTING AGE 18 and over population | 2,453 |
Social characteristics in BURNET, TX
| Total households | 2,000 |
| Family households (families) | 1,375 |
| Married-couple family | 1,053 |
| Male householder, no wife present, family | 87 |
| Female householder, no husband present, family | 235 |
| Nonfamily households | 625 |
| Average household size | 2.91 |
| Average family size | 3.11 |
Economic characteristics in BURNET, TX
| Total households | 2,000 |
| Less than $10,000 | 38 |
| $10,000 to $14,999 | 114 |
| $15,000 to $24,999 | 338 |
| $25,000 to $34,999 | 126 |
| $35,000 to $49,999 | 207 |
| $50,000 to $74,999 | 613 |
| $75,000 to $99,999 | 149 |
| $100,000 to $149,999 | 316 |
| $150,000 to $199,999 | 73 |
| $200,000 or more | 26 |
| Median household income (dollars) | 59,130 |
Housing characteristics in BURNET, TX
| Total housing units | 2,193 |
| Occupied housing units | 2,000 |
| Vacant housing units | 193 |
| Total housing units | 2,193 |
| 1-unit, detached | 1,587 |
| 1-unit, attached | 142 |
| 2 units | 14 |
| 3 or 4 units | 226 |
| 5 to 9 units | 12 |
| 10 to 19 units | 56 |
| 20 or more units | 96 |
| Mobile home | 60 |
| Boat, RV, van, etc. | 0 |
| Total housing units | 2,193 |
| Built 2014 or later | 68 |
| Built 2010 to 2013 | 79 |
| Built 2000 to 2009 | 622 |
| Built 1990 to 1999 | 180 |
| Built 1980 to 1989 | 275 |
| Built 1970 to 1979 | 360 |
| Built 1960 to 1969 | 309 |
| Built 1950 to 1959 | 199 |
| Built 1940 to 1949 | 18 |
| Built 1939 or earlier | 83 |
| Total housing units | 2,193 |
| 1 room | 53 |
| 2 rooms | 0 |
| 3 rooms | 180 |
| 4 rooms | 379 |
| 5 rooms | 543 |
| 6 rooms | 450 |
| 7 rooms | 293 |
| 8 rooms | 232 |
| 9 rooms or more | 63 |
| Median rooms | 5.4 |
| Total housing units | 2,193 |
| No bedroom | 53 |
| 1 bedroom | 59 |
| 2 bedrooms | 678 |
| 3 bedrooms | 1,076 |
| 4 bedrooms | 278 |
| 5 or more bedrooms | 49 |
| Occupied housing units | 2,000 |
| Owner-occupied | 1,215 |
| Renter-occupied | 785 |
| Average household size of owner-occupied unit | 2.80 |
| Average household size of renter-occupied unit | 3.07 |
| Occupied housing units | 2,000 |
| Moved in 2017 or later | 76 |
| Moved in 2015 to 2016 | 293 |
| Moved in 2010 to 2014 | 829 |
| Moved in 2000 to 2009 | 556 |
| Moved in 1990 to 1999 | 119 |
| Moved in 1989 and earlier | 127 |
| Owner-occupied units | 1,215 |
| Less than $50,000 | 39 |
| $50,000 to $99,999 | 271 |
| $100,000 to $149,999 | 313 |
| $150,000 to $199,999 | 242 |
| $200,000 to $299,999 | 192 |
| $300,000 to $499,999 | 135 |
| $500,000 to $999,999 | 23 |
| $1,000,000 or more | 0 |
| Median (dollars) | 147,000 |
| Owner-occupied units | 1,215 |
| Housing units with a mortgage | 603 |
| Housing units without a mortgage | 612 |
| Occupied units paying rent | 744 |
| Less than $500 | 116 |
| $500 to $999 | 461 |
| $1,000 to $1,499 | 112 |
| $1,500 to $1,999 | 55 |
| $2,000 to $2,499 | 0 |
| $2,500 to $2,999 | 0 |
| $3,000 or more | 0 |
| Median (dollars) | 743 |
| No rent paid | 41 |
Data is based on 2018 Census
ZIP Codes for other locations
State for BURNET
Texas ZIP CodesOther cities in Texas