CIBOLO, TX ZIP Code
| City | CIBOLO |
| State | Texas |
| ZIP Codes count | 1 (see all) |
| Post offices count | 1 (see all) |
| Total population | 27,963 (see all) |
ZIP Code in CIBOLO, Texas
78108
This list contains only 5-digit ZIP codes. Use our zip code lookup by address feature to get the full 9-digit (ZIP+4) code.
List of CIBOLO, TX ZIP Codes
| ZIP | TYPE | POPU |
|---|---|---|
| 78108 | STANDARD | 44,734 |
Post offices
CIBOLO — Post Office™ 725 FM 1103 CIBOLO, TX 78108-9998 |
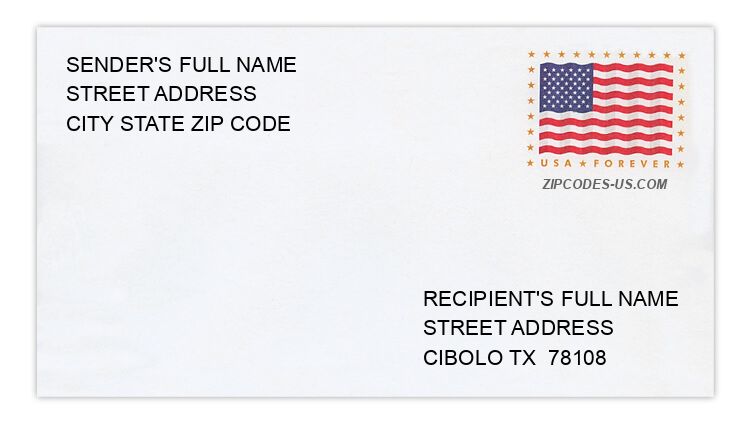
Envelope example
On the bottom center of the envelope, write the address you want your letter delivered to. Include the following on separate lines:
- Recipient's full name
- Full street address
- City, State, and ZIP Code
Using the same format, write the return address in the top left corner.
Using the full ZIP+4 Code when mailing via the USPS ensures the fastest, most accurate mailing possible. If you are not sure of the full 9-digit ZIP Code, use the 5-digit ZIP Code to avoid loss of letter or package.
The recipient address information is provided for your reference.
Address example
3353 CHARLESTON LN
CIBOLO TX 78108-2002
CIBOLO TX 78108-2002
481 CONCORDIA LN
CIBOLO TX 78108-3950
CIBOLO TX 78108-3950
180 DEWBERRY PARK
CIBOLO TX 78108-2270
CIBOLO TX 78108-2270
188 EVENING BREEZE
CIBOLO TX 78108-4264
CIBOLO TX 78108-4264
304 HORNBEAN LN
CIBOLO TX 78108-3147
CIBOLO TX 78108-3147
259 JACQUELINE ST
CIBOLO TX 78108-3734
CIBOLO TX 78108-3734
Map
Hover over the map to see the ZIP code
Census data for CIBOLO, TX
Demographic and housing estimates in CIBOLO, TX
| Total population | 27,963 |
| Male | 13,857 |
| Female | 14,106 |
| Total population | 27,963 |
| Under 5 years | 1,838 |
| 5 to 9 years | 2,624 |
| 10 to 14 years | 2,303 |
| 15 to 19 years | 2,804 |
| 20 to 24 years | 1,571 |
| 25 to 34 years | 3,259 |
| 35 to 44 years | 5,093 |
| 45 to 54 years | 4,231 |
| 55 to 59 years | 1,344 |
| 60 to 64 years | 801 |
| 65 to 74 years | 1,576 |
| 75 to 84 years | 371 |
| 85 years and over | 148 |
| Median age (years) | 33.9 |
| Under 18 years | 8,387 |
| 16 years and over | 20,649 |
| 18 years and over | 19,576 |
| 21 years and over | 17,978 |
| 62 years and over | 2,494 |
| 65 years and over | 2,095 |
| Total population | 27,963 |
| One race | 26,885 |
| White | 18,554 |
| Black or African American | 3,999 |
| American Indian and Alaska Native | 89 |
| Asian | 595 |
| Native Hawaiian and Other Pacific Islander | 212 |
| Some other race | 3,436 |
| Two or more races | 1,078 |
| Citizen, VOTING AGE 18 and over population | 18,954 |
| Male Citizen, VOTING AGE 18 and over population | 9,505 |
| Female Citizen, VOTING AGE 18 and over population | 9,449 |
Social characteristics in CIBOLO, TX
| Total households | 8,435 |
| Family households (families) | 7,369 |
| Married-couple family | 5,835 |
| Male householder, no wife present, family | 428 |
| Female householder, no husband present, family | 1,106 |
| Nonfamily households | 1,066 |
| Average household size | 3.32 |
| Average family size | 3.54 |
Economic characteristics in CIBOLO, TX
| Total households | 8,435 |
| Less than $10,000 | 185 |
| $10,000 to $14,999 | 112 |
| $15,000 to $24,999 | 277 |
| $25,000 to $34,999 | 285 |
| $35,000 to $49,999 | 594 |
| $50,000 to $74,999 | 1,392 |
| $75,000 to $99,999 | 1,499 |
| $100,000 to $149,999 | 2,492 |
| $150,000 to $199,999 | 915 |
| $200,000 or more | 684 |
| Median household income (dollars) | 97,277 |
Housing characteristics in CIBOLO, TX
| Total housing units | 8,691 |
| Occupied housing units | 8,435 |
| Vacant housing units | 256 |
| Total housing units | 8,691 |
| 1-unit, detached | 8,152 |
| 1-unit, attached | 26 |
| 2 units | 0 |
| 3 or 4 units | 0 |
| 5 to 9 units | 37 |
| 10 to 19 units | 66 |
| 20 or more units | 0 |
| Mobile home | 410 |
| Boat, RV, van, etc. | 0 |
| Total housing units | 8,691 |
| Built 2014 or later | 708 |
| Built 2010 to 2013 | 1,368 |
| Built 2000 to 2009 | 4,495 |
| Built 1990 to 1999 | 874 |
| Built 1980 to 1989 | 619 |
| Built 1970 to 1979 | 330 |
| Built 1960 to 1969 | 55 |
| Built 1950 to 1959 | 139 |
| Built 1940 to 1949 | 22 |
| Built 1939 or earlier | 81 |
| Total housing units | 8,691 |
| 1 room | 23 |
| 2 rooms | 13 |
| 3 rooms | 131 |
| 4 rooms | 470 |
| 5 rooms | 1,145 |
| 6 rooms | 1,079 |
| 7 rooms | 1,982 |
| 8 rooms | 1,981 |
| 9 rooms or more | 1,867 |
| Median rooms | 7.2 |
| Total housing units | 8,691 |
| No bedroom | 23 |
| 1 bedroom | 125 |
| 2 bedrooms | 508 |
| 3 bedrooms | 3,502 |
| 4 bedrooms | 3,738 |
| 5 or more bedrooms | 795 |
| Occupied housing units | 8,435 |
| Owner-occupied | 6,899 |
| Renter-occupied | 1,536 |
| Average household size of owner-occupied unit | 3.28 |
| Average household size of renter-occupied unit | 3.49 |
| Occupied housing units | 8,435 |
| Moved in 2017 or later | 660 |
| Moved in 2015 to 2016 | 1,077 |
| Moved in 2010 to 2014 | 3,019 |
| Moved in 2000 to 2009 | 3,111 |
| Moved in 1990 to 1999 | 328 |
| Moved in 1989 and earlier | 240 |
| Owner-occupied units | 6,899 |
| Less than $50,000 | 155 |
| $50,000 to $99,999 | 190 |
| $100,000 to $149,999 | 534 |
| $150,000 to $199,999 | 1,669 |
| $200,000 to $299,999 | 3,456 |
| $300,000 to $499,999 | 788 |
| $500,000 to $999,999 | 33 |
| $1,000,000 or more | 74 |
| Median (dollars) | 222,800 |
| Owner-occupied units | 6,899 |
| Housing units with a mortgage | 5,564 |
| Housing units without a mortgage | 1,335 |
| Occupied units paying rent | 1,493 |
| Less than $500 | 23 |
| $500 to $999 | 157 |
| $1,000 to $1,499 | 278 |
| $1,500 to $1,999 | 716 |
| $2,000 to $2,499 | 319 |
| $2,500 to $2,999 | 0 |
| $3,000 or more | 0 |
| Median (dollars) | 1,701 |
| No rent paid | 43 |
Data is based on 2018 Census
ZIP Codes for other locations
State for CIBOLO
Texas ZIP CodesOther cities in Texas